


The Five Strategies Driving Massive Moats
Unpacking Enduring Competitive Advantage: A Synthesis of Helmer's 7 Powers and Morningstar's 5 Economic Moats

In this Article
This article elucidates the seven powers, identified by Hamilton Helmer (2016) as foundational to robust corporate strategies, and integrates them with Morningstar's concept of economic moats. The objective is to define five powerful strategic pillars through which quality companies generate shareholder value.
The discussion commences with a review of the theoretical underpinnings of economic moats, building on the articles I published earlier as part of my ongoing research into the world of massive moats.
Review of Previous Articles
In previous articles, we have further refined our focus within the financial markets. Based on over 200 years of historical data (e.g., Siegel, 2014), we established that equities represent the most compelling asset class for us as long-term investors.
Only 4.3% Generate Alpha
Bessembinder's (2018) research subsequently demonstrated that a disproportionately small fraction of companies are responsible for the vast majority of value creation in financial markets. His study (n = 25,967) revealed that during the 1926-2016 period, only 4.3% of stocks generated alpha relative to one-month Treasury bill returns. The remaining 95.8% collectively delivered returns equivalent to one-month Treasury bills over their lifetimes. Bessembinder also found that the top 90 companies (0.33% of the total) contributed over 50% of the market's total value creation, expressed as an increase in market capitalization, between 1926 and 2016.
Passive investors in funds and ETFs consciously choose to allow market forces to operate, capitalizing on the highly positive asymmetry that the stock market has historically exhibited. Should past trends persist, the majority of companies in which they hold an (indirect) interest will generate little to no real value. This implies that a small percentage of companies will drive the bulk of value creation in financial markets in the future as well.
Value Creation Begins with the Customer
In the article of June 27, 2025, we aimed to delineate why certain companies successfully create shareholder value while others largely fail to generate real shareholder value, or even destroy it.
We determined that for companies to create shareholder value, they must first generate value for their customers and, by extension, society. Without a minimum consumer surplus, companies will lack sustainable demand for their products and/or services.
Our conclusion was that only companies capable of both creating value for their customers and capturing a commission on this added value can generate value at the enterprise level—and thus for us as shareholders.
The article published on June 27, 2025, can be accessed via the link below:

Porter's Five Forces
In the previous article, we also established that various forces exert pressure on companies. Porter (1980) identified the following five forces: suppliers, customers, new entrants (disruption), substitutes, and existing competitive rivalry.
For sustainable value creation, companies must effectively counter these five forces. In essence, only companies capable of protecting themselves against these pressures will be able to consistently create value. Strong competitive advantages, massive moats, serve as safeguards against these forces.
Furthermore, we determined that secular growth acts as a multiplier for a company's moat-driven value creation. A moat is therefore not merely a protective barrier shielding a company from external influences; it also constitutes the primary engine for future value creation. When management continuously reinforces the moat and pursues profitable secular growth opportunities, it transforms into a powerful mechanism for exponential value creation, akin to compounding.
7 Powers (Helmer, 2016)
Today, we will delineate Morningstar's five economic moats, which, in my view, effectively categorize the principal strategies behind moats. Before delving into these, it's essential to examine the underlying powers that drive them. Hamilton Helmer, in his work 7 Powers, has, in my opinion, articulately described these.
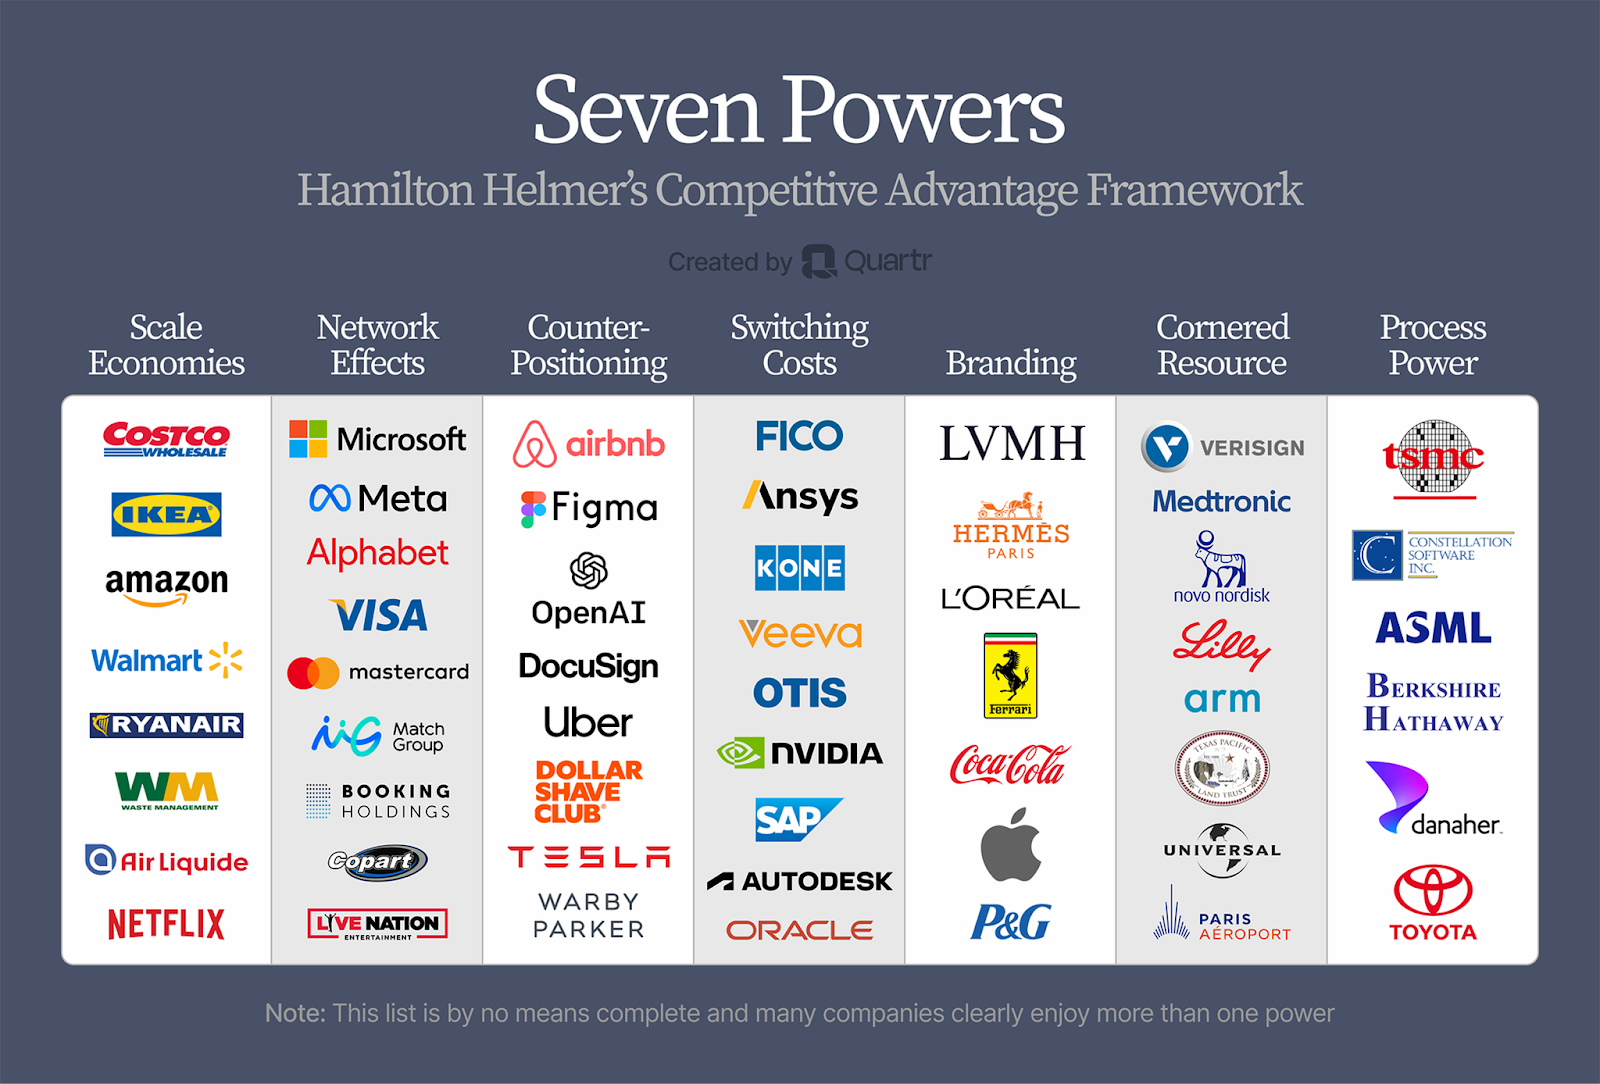
In his book, 7 Powers: The Foundations of Business Strategy (2016), Hamilton Helmer identified the following seven distinct powers that form the bedrock of successful corporate strategies:
Scale Economies;
Network Economies;
Counter-Positioning;
Switching Costs;
Branding;
Cornered Resource;
Process Power.
Scale Economies
Helmer illustrates the power of scale economies using Netflix as a prime example. Netflix made the audacious strategic move to start to produce its own content rather than solely licensing it from film studios. While this entailed significant upfront capital expenditure in absolute terms, particularly given Netflix's earlier scale, the per-subscriber cost steadily decreased as its subscriber base grew. Helmer defines Scale Economies as:
“A business in which per unit cost declines as production volume increases.”
— Hamilton Helmer (2016)
Extending this to Netflix, the company can effectively amortize the production cost of a new series across its millions of global subscribers. This enables Netflix to achieve a lower per-subscriber cost than its competitors. The fixed costs of producing a film or series generally remain constant for a given studio, whereas the cost per user [unit] can vary significantly.
Netflix's strategy leveraged the creation of a broader content offering than its rivals. Conversely, other companies benefiting from scale economies often focus on lower product pricing. Examples include Costco, Action (3i Group), and Amazon—all companies that realize increasing scale advantages as they expand.
Network Economies
In businesses leveraging Network Economies, the value derived by a single user increases proportionally with the growth in the platform's user base. Consider Meta Platforms' Facebook and Instagram, where an individual user would gain virtually no utility in isolation. However, as more users join the platform, the value we, as individual users, obtain escalates. Helmer defines Network Economies in his book as:
“A business in which the value realized by a customer increases as the installed base increases.”
— Hamilton Helmer (2016)
Marketplaces like eBay and Amazon, which connect buyers and sellers, serve as further examples. Theoretically, an increase in one group leads to an expansion in the other. For instance, as Amazon's product offering broadens, more customers will visit the platform, thereby increasing the incentive for new sellers to list their products on Amazon. These dynamics are central to Amazon's flywheel effect:
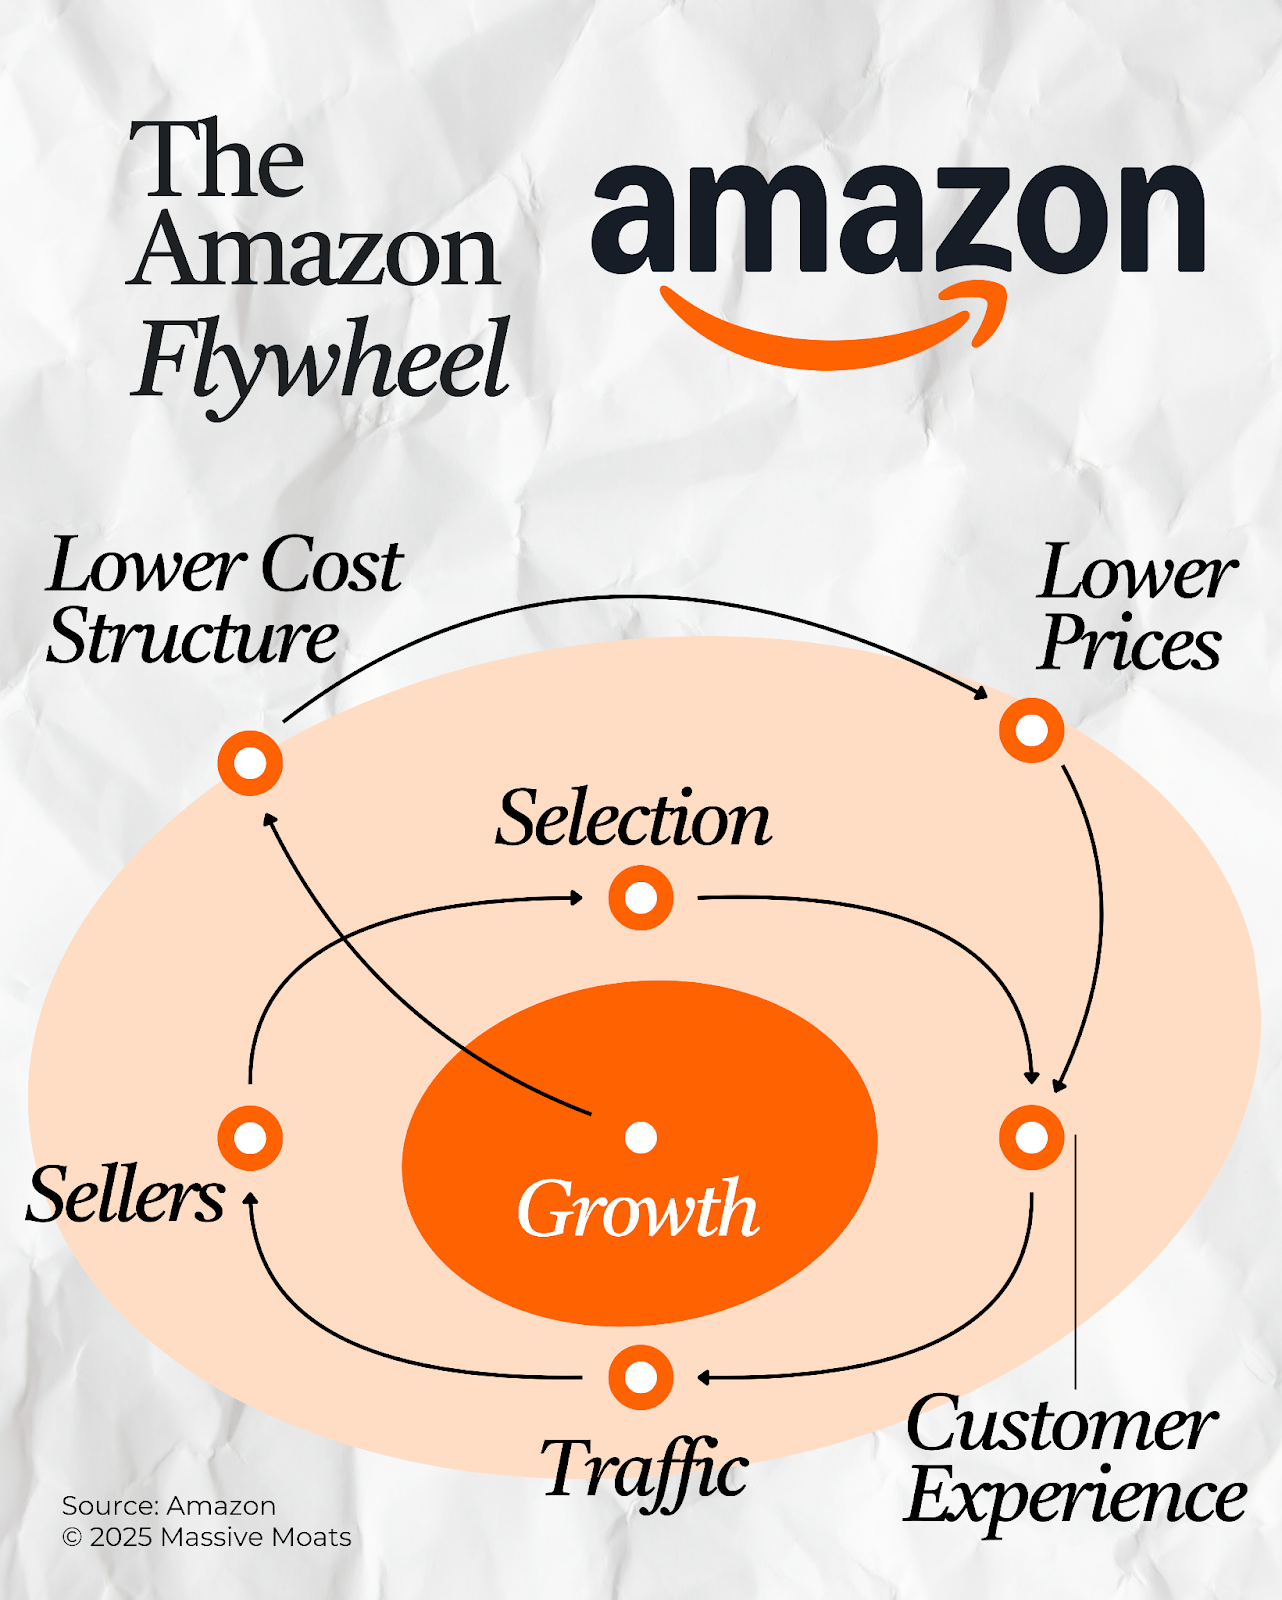
A Deep Dive into Amazon is available here:

Furthermore, Network Economies also apply to payment systems such as Visa and Mastercard, which become more valuable as both consumers and merchants increasingly adopt and support them.
Counter-Positioning
Counter-Positioning describes a strategic power where a newcomer with a superior business model challenges the status quo in an established market, and incumbent players are unable to respond effectively without undermining their own profitable positions. This power, therefore, hinges not only on innovation but also on the entrenched players being constrained by their existing strategies, cost structures, or customer relationships.
According to Helmer, Counter-Positioning emerges when a new entrant introduces a fundamentally different business model that is cheaper, more efficient, or more customer-centric—often enabled by technological advancements, digitalization, or a radically different cost structure. While established players often foresee this innovation, they are either unwilling or unable to react. The rationale? A direct response (e.g., price reductions) would cannibalize their existing revenue streams and trigger internal resistance.
A pertinent example from the financial sector is how various fintech startups have challenged traditional banks with novel models for investing or banking. Online brokers such as Robinhood, by offering significantly lower transaction costs, rapidly gained market share from traditional banks. These banks had long relied on high transaction fees as a stable income source. By offering a more economical service themselves, they would erode their own margins and potentially confuse or shift customers within their existing product offerings. Consequently, many incumbents initially adhered to their old models, thereby paving the way for new entrants to achieve rapid growth. Helmer defines Counter-Positioning as:
“A newcomer adopts a new, superior business model which the incumbent does not mimic due to anticipated damage to their existing business.”
— Hamilton Helmer (2016)
It is crucial to note that, in isolation, this power does not constitute a moat; we will elaborate on this later. This power arises when opportunities exist within a market to further expand consumer surplus, and consequently shareholder value, provided this is executed efficiently.
Often, nascent companies identify these market opportunities and adopt a counter-position against established players. However, this alone does not guarantee success: other (startup) companies will also attempt to capitalize on possibilities in such a market. Additionally, incumbent firms might ultimately pivot and compete with new entrants. While this will ultimately benefit consumers, it does not inherently guarantee value creation for the companies themselves.
Switching Costs
Switching Costs denote the strategic power that arises when customers face significant disadvantages when moving from one provider to another. These costs, which can be financial or psychological, create a barrier protecting companies from customer attrition. According to Helmer, this power emerges when a firm successfully integrates its product or service so deeply into the client's operational structure that a transition entails considerable effort, expense, and potential risk. Helmer defines Switching Costs in his book as:
“The value loss expected by a customer that would be incurred from switching to an alternate supplier for additional purchases.”
— Hamilton Helmer (2016)
An example is the German software company SAP, which delivers complex enterprise resource planning (ERP) systems to large organizations. The implementation of such a system typically involves a protracted and intensive process of consultancy, internal process adjustments, employee training, and iterative improvements.
Because these systems become deeply embedded in the core functions of an organization (e.g., finance, HR, logistics, and procurement), switching vendors transforms into a profound and costly undertaking. This includes not only direct expenses (capital, time) associated with migrating to a new system but also temporary disruptions to business processes, the need for staff retraining, and the risk of downtime or errors.
Consequently, even when seemingly cheaper or more user-friendly alternatives exist in the market, companies will be reluctant to switch. They face renewed investments in time, capital, and trust, alongside the risk of a temporary decline in operational efficiency. This customer entrenchment can constitute a durable competitive advantage for the incumbent supplier.
In addition, consider the ecosystem cultivated by Apple, where consumers often possess a smartphone (iPhone), tablet (iPad), and laptop (MacBook) that are seamlessly interconnected via iCloud.
Helmer emphasizes that Switching Costs gain significant potency when coupled with high customer satisfaction: if clients are content with the existing system and find it difficult to transition, loyalty and customer lifetime value increase. This, in turn, grants companies the ability to exert pricing power, thereby attempting to capture a portion of the expanding consumer surplus.
Branding
According to Helmer, consumers may ascribe a higher value to a product or service based on the information associated with the seller:
“The durable attribution of higher value to an objectively identical offering that arises from historical information about the seller.”
— Hamilton Helmer (2016)
Consider the heritage of a brand like Hermès, established in 1837, and its positioning in the market for luxury cultivated over recent decades. Due to Hermès’ unique history and the scarcity of comparable compelling narratives, the company can, by adhering to its core values of craftsmanship, artistry, creativity, and authenticity, command a higher selling price for its products than competitors could for objectively identical items lacking the Hermès logo.
For two otherwise identical handbags, the perceived (emotional) value attributed by the consumer, and thus their allocated consumer surplus, can differ significantly if one bag bears the Hermès logo while the other does not. Even if two products deliver precisely the same utility, brand perception can diverge merely due to the presence of logos.
This underscores why storytelling is a critical component for companies that rely on the power of Branding. However, Branding on its own does not constitute a moat. More on this later in the article.
Cornered Resource
Cornered Resources refer to unique assets possessed by companies that are difficult for competitors to replicate or acquire. These resources provide a market advantage by offering exclusive access to something valuable or scarce. Examples include patents, commonly observed in the technology and pharmaceutical sectors, where only the patent-holding company is legally permitted to produce and sell a specific drug or technology.
However, cornered resources extend beyond intellectual property. They can also encompass physical assets, such as unique natural resources. In his book, Helmer cites the example of a cement producer owning a nearby limestone quarry. This not only offers cost advantages (e.g., reduced transportation costs) but also a strategic edge when competitors cannot easily secure a comparable location. Helmer defines Cornered Resource as:
“Preferential access at attractive terms to a coveted asset that can independently enhance value.”
— Hamilton Helmer (2016)
Process Power
Process Power denotes the strategic advantage derived from unique, optimized business processes that are difficult to replicate. According to Helmer, this power is not spontaneously generated but rather accrues over an extended period of learning, experimentation, refinement, and integration within an organization. It pertains to processes that either significantly enhance product quality or reduce operational costs—and ideally, both.
What distinguishes Process Power from general efficiency or transient optimizations is its durability and complexity. While competitors might observe that a company operates more efficiently, the "how" is often opaque. And even when discernible, replicating those processes proves exceptionally challenging. This difficulty stems from a combination of factors, including firm-specific knowledge, organizational culture, underlying processes and systems, personnel training, and the fine-tuning accumulated from years of experience.
Helmer emphasizes that Process Power is often inscrutable to outsiders. Consider, for instance, a logistics company that has meticulously optimized its supply chain over many years to flawlessly accommodate demand and supply fluctuations, or a manufacturer that achieves exceptionally high yield rates through thousands of incremental production improvements. Such achievements cannot be simply purchased or duplicated. Accordingly, Helmer defines Process Power as:
“Embedded company organization and activity sets which enable lower costs and/or superior product, and which can be matched only by an extended commitment.”
— Hamilton Helmer (2016)
The figure below provides additional examples of companies illustrating Hamilton Helmer's 7 Powers.
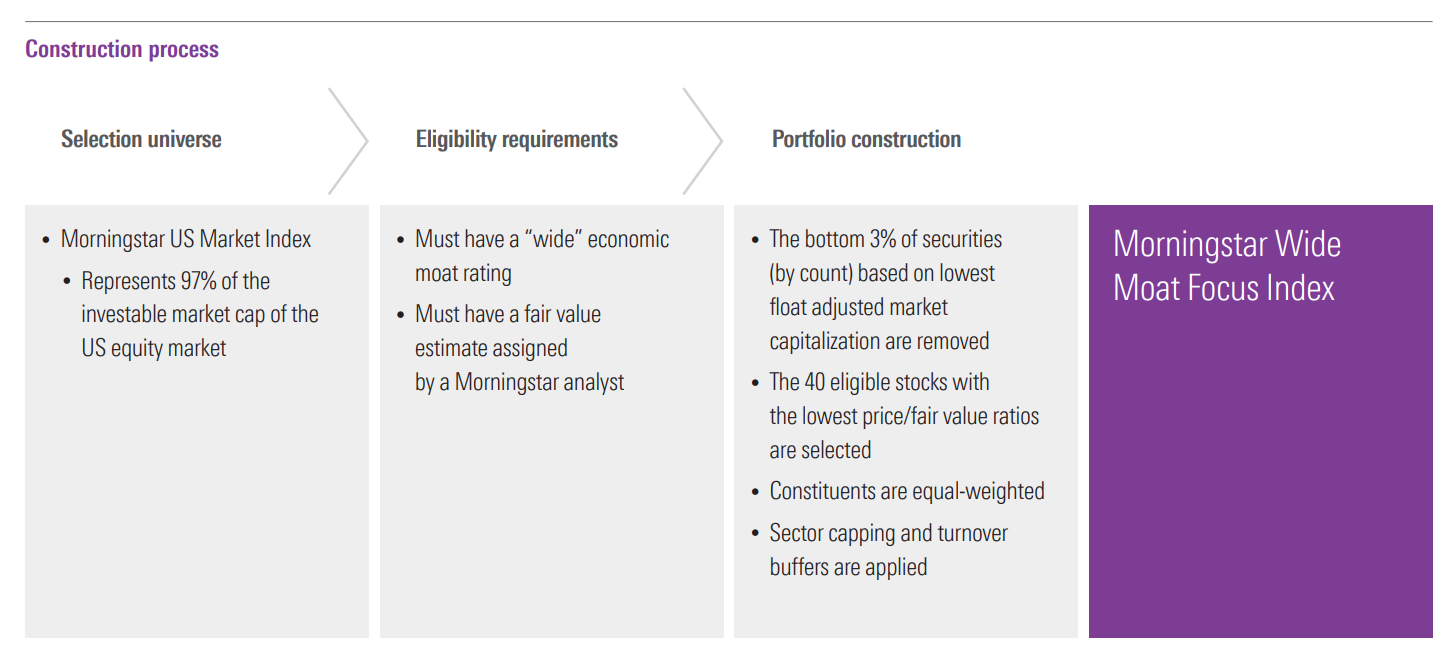
Morningstar Wide Moat Focus Index
Morningstar is the creator of the Morningstar Wide Moat Focus Index. Since its inception in 2002, this index has delivered a CAGR of 12.7% (versus the S&P 500's 10.4% CAGR) (Morningstar Direct, 2025).
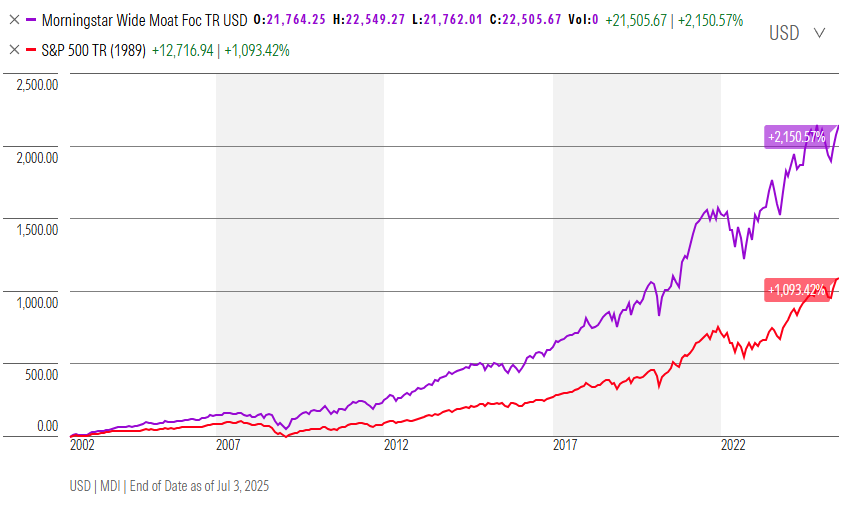
Morningstar selects companies for this index that possess a "Wide Moat"—meaning their competitive advantages are expected to persist for over 20 years—while also considering their valuation. This approach combines both qualitative and quantitative (valuation-driven) criteria.
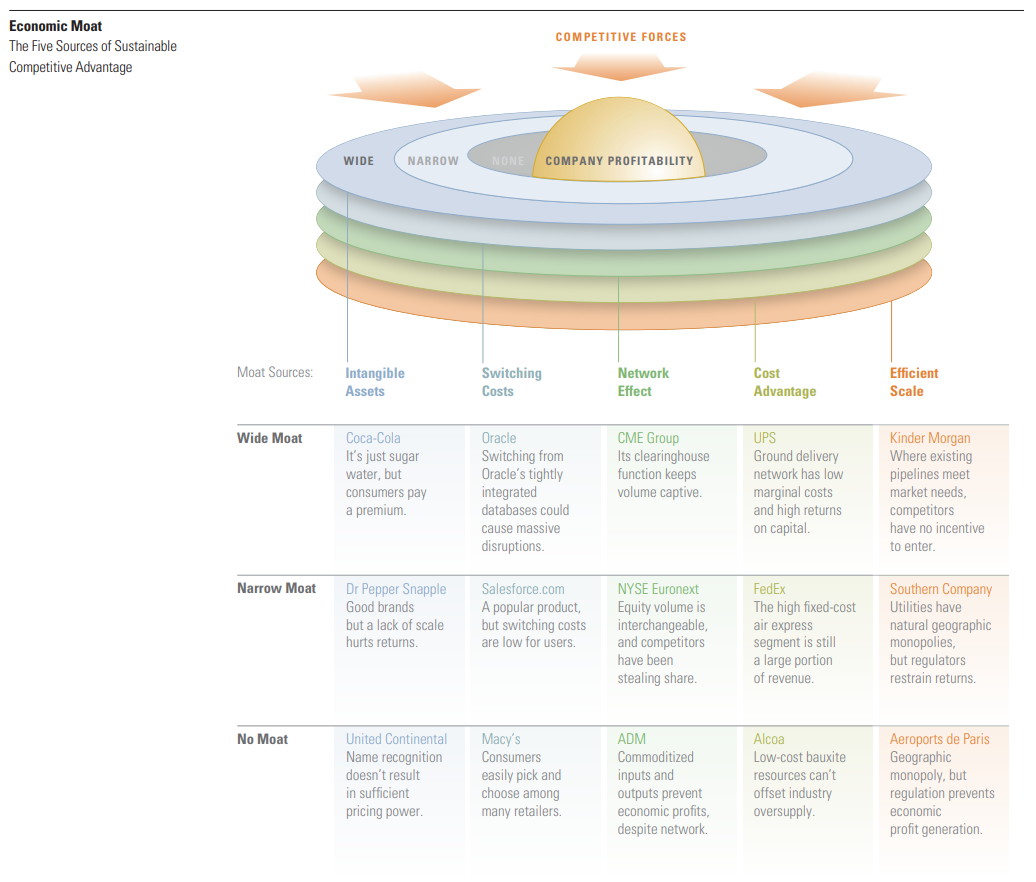
Morningstar’s 5 Sources of Moats
Morningstar has identified five primary sources of economic moats:
Intangible Assets;
Switching Costs;
Network Effect;
Cost Advantage;
Efficient Scale.
Please refer to the figure below for a visual representation.
As of June 30, 2025, Morningstar's Full Holdings (2025) comprises 54 companies. Beyond prominent names like Amazon, Alphabet, and Microsoft, the index also includes companies such as Nike, Adobe, Estée Lauder, PepsiCo, and Walt Disney. Based on my own criteria on massive moats, I would not include the latter five companies in my portfolio, but that is a discussion for another time.
Nevertheless, Morningstar's five defined competitive advantages are, in my view, highly effective for classifying the different categories in the world of moats. A more detailed exposition of these five moat categories follows below.
Cost Advantage
As a company's scale expands, its marginal (unit) cost per product sold decreases.
When a company, with increasing scale, subsequently passes on a portion of these cost savings to its customers through price reductions, this forms the basis for further scaling, and subsequently provides the opportunity to build a business model around the concept of Scale Economies Shared. (More on this in the upcoming article, where we will dive into the wisdom of Nick Sleep and Qais Zakaria of Nomad Investment Partners.)
Examples of moats based on Cost Advantage include retail companies such as Costco Wholesale, Action (3i Group), and Amazon. Home improvement retailers and large conglomerates such as IKEA also benefit from their increasing scale.
The shared strategy underpinning the playbooks for creating a moat based on cost advantages manifests in the continuous expansion of their scale by reinvesting operational free cash flows into growth. This strategy is driven by lower prices aimed at generating substantial consumer surplus, thereby stimulating consumer demand.
Network Effects
Companies possessing a moat derived from Network Effects become more valuable as more users engage with the company's established network (e.g., platforms).
For instance, companies like Facebook and Instagram (Meta Platforms) rely on their users for content and interaction. This user-generated content is also evident with YouTube, where creators upload content for consumption by users. In these cases, these companies serve as platforms facilitating the connection between content creators and their audiences.
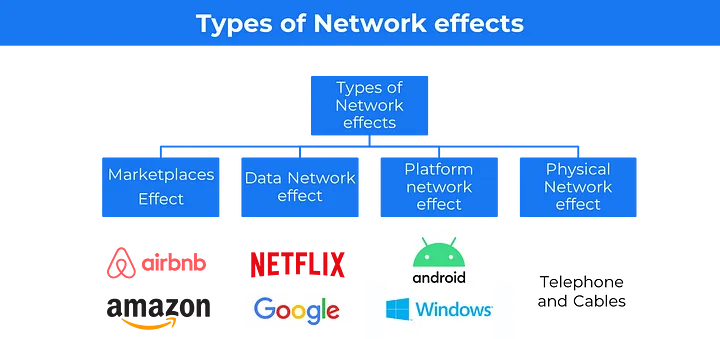
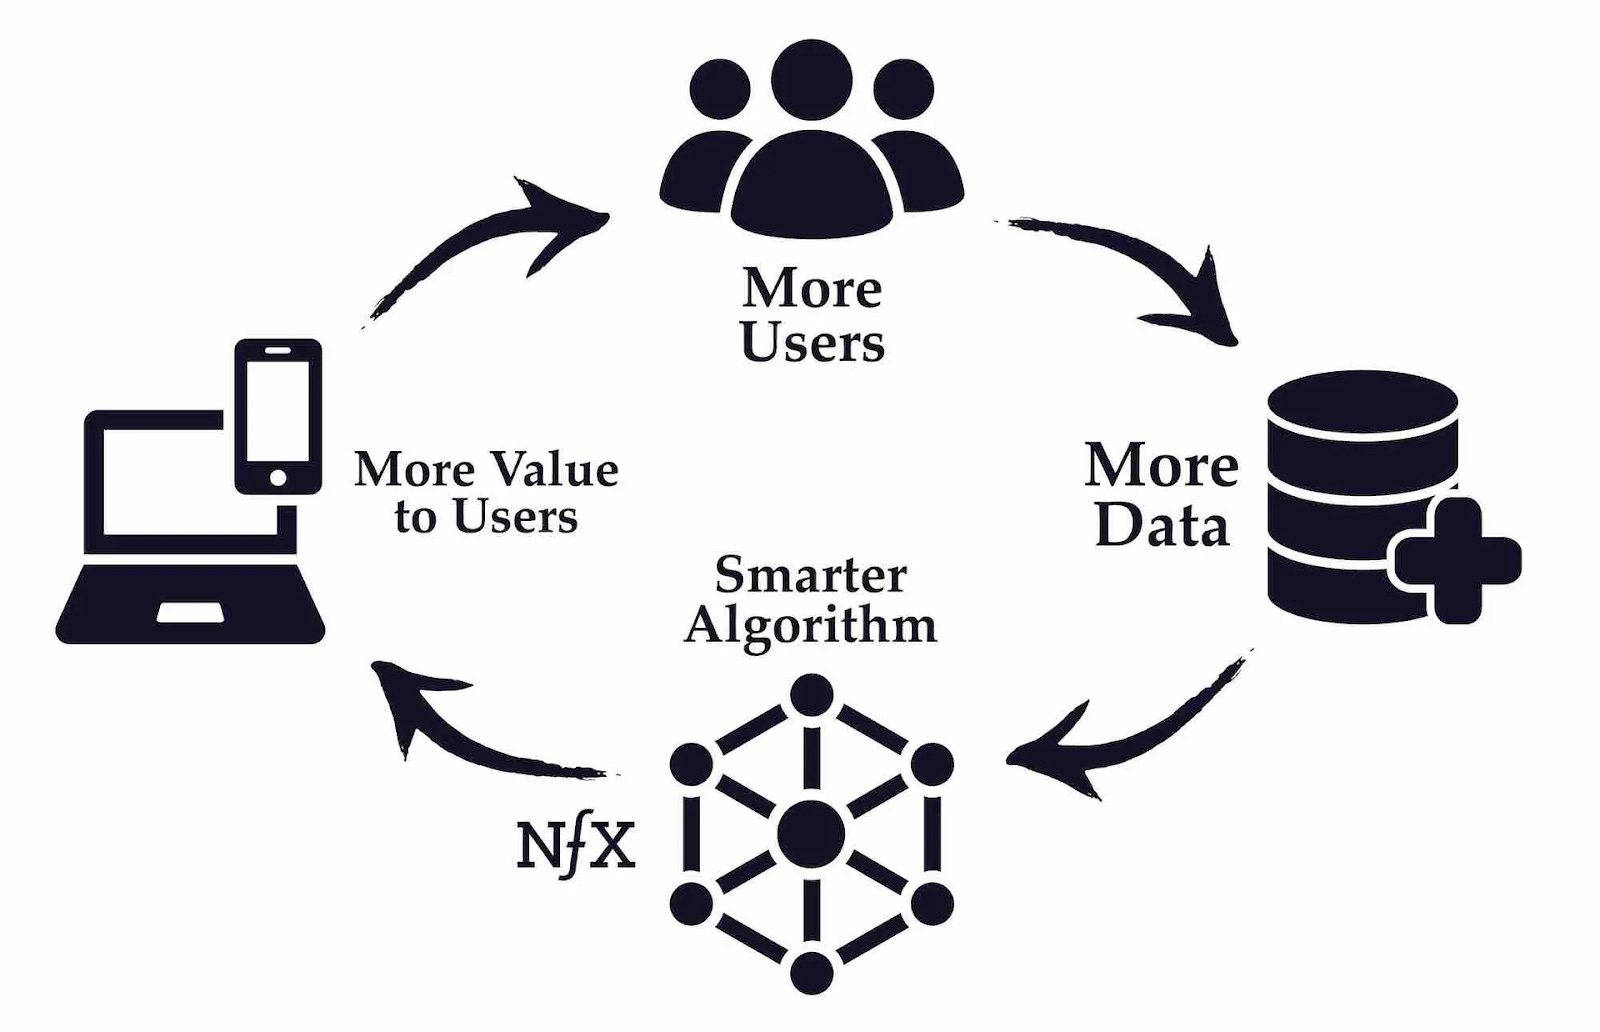
Furthermore, a data feedback loop can contribute to value creation. Google Search, for example, continuously improved as more users utilized the search engine, enabling the company to refine its algorithms, which in turn enhanced the quality of its search results.
Marketplaces such as Airbnb and Amazon (third-party sellers) create value by aggregating both supply-side participants (e.g., hosts, merchants) and demand-side participants (consumers) on their platforms, while capturing a commission.
The strategy for building a moat based on Network Effects centers on connecting users or bringing together suppliers and consumers, to foster increasing network effects.
Switching Costs
Companies can derive advantages from engineered switching costs when their product (often a service) is deeply integrated with the client's operations.
Consider the German software company SAP, as discussed previously, which implements enterprise systems. These systems then integrate with other internal systems and networks within the client's organization.
High switching costs are present when migrating to alternative providers incurs significant expenses in terms of capital, time (which can also be quantified financially), and relationships—the existing ties with current suppliers and their products/services.
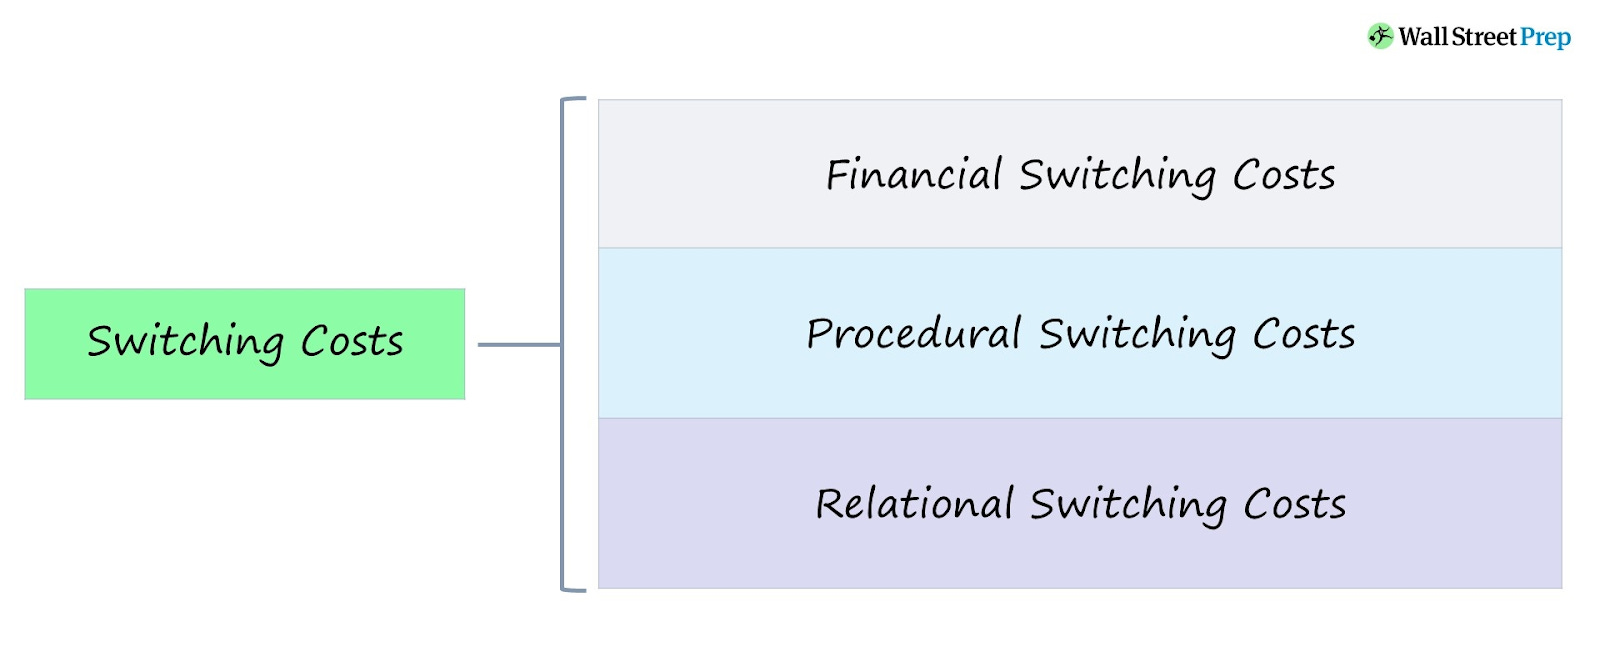
The strategy companies should adopt for creating or maintaining a moat based on Switching Costs hinges on establishing financial, procedural, or relational barriers or lock-in effects within the products and/or services they offer.
However, with the advent of a new wave of artificial intelligence-powered technology providers (e.g., Palantir), existing switching costs could potentially become obsolete. Therefore, unlike many other investors, I am not particularly enthusiastic about certain SaaS companies or VMS serial acquirers.
Intangible Assets
Companies categorized under Intangible Assets gain advantages from their non-physical, non-tangible holdings. This often includes patents and brand rights.
Patents
Companies like Novo Nordisk and ASML possess patented medications and technologies that enable them to achieve above-average margins on their developed products and services. Maintaining a lead over competitors is also crucial, as innovation can lead to variations on existing technology, allowing for alternative approaches to existing patents.
Companies that fail to continue innovation, or appear to rely solely on existing patents, risk losing their ability to generate above-average returns on their investments once those patents expire. Therefore, it is critical for such companies to continuously invest in their future earning potential.
Brands
Although companies like Hermès and LVMH do not sell a unique product such as an EUV machine (ASML), they can command above-average gross margins due to the emotional connection consumers have with their brands, which are also patented. This concept was discussed earlier in relation to the "Branding" power and Helmer's explanation.
The strategy for moats based on Intangible Assets involves continuous investment in R&D processes, or the safeguarding and further development of other intangible assets such as brand names, to ensure their sustained contribution to a durable competitive advantage in the future.
Efficient Scale
Companies benefiting from an Efficient Scale moat typically operate in mature, already "divided" markets. Consequently, it is often economically unappealing for new entrants to compete in these sectors. These industries frequently exhibit a stronger relationship with, and oversight from, governmental bodies compared to other businesses.
Examples of companies leveraging Efficient Scale include utilities, as well as airport, railway, and port operators.
A downside of this moat, particularly for entities like airports, is that expansion is often constrained (e.g., urban airports). This limitation can hinder growth in physical size. However, this inherent constraint simultaneously underpins the strength of such businesses: the market structure is already established, leaving little room for new competitors. This, in turn, can create opportunities for pricing power.
You'll frequently find mini-monopolies among companies with an Efficient Scale moat. A key risk emerges when government intervention becomes excessive, interfering with these companies' ability to exercise their pricing power.
7 Powers → 5 Moats
This chapter integrates Hamilton Helmer's 7 Powers with Morningstar's 5 Economic Moats. Moats are formed when companies consistently work to strengthen their underlying powers (e.g., Helmer's 7 Powers), ultimately developing a formidable advantage that minimizes or neutralizes the influence of Porter's five (negative) forces. Building a robust moat is often a protracted process spanning many decades.
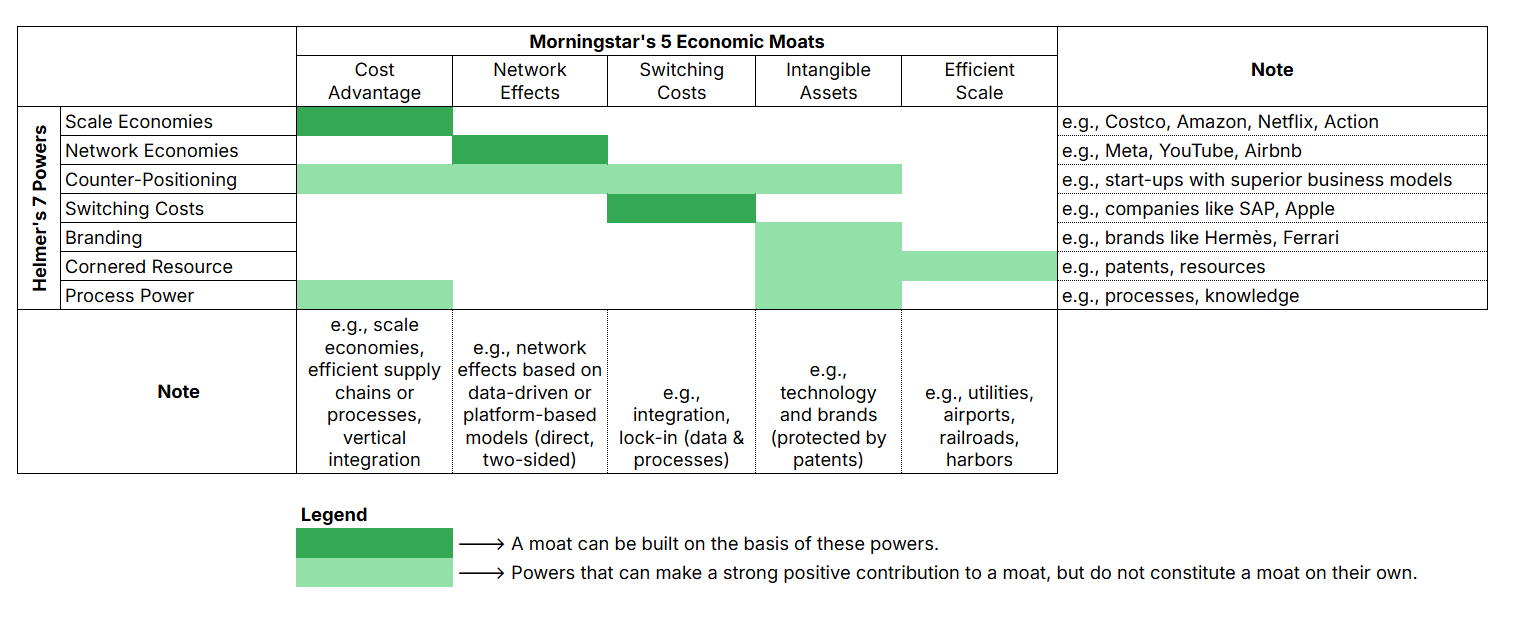
The figure above illustrates my personal interpretation of the connections between Helmer's 7 Powers and Morningstar's 5 Economic Moats. The following linkages are relatively straightforward:
Strengths derived from Scale Economies can lead to a moat based on Cost Advantage.
Strengths derived from Network Economies can lead to a moat based on Network Effects.
Strengths derived from Switching Costs can lead to a moat based on Switching Costs.
Below is an elucidation of the other connections I have formulated.
Counter-Positioning —> Network Effects, Switching Costs, Intangible Assets, Cost Advantage
As previously indicated, the power of Counter-Positioning does not, in itself, constitute a moat. While companies like Airbnb, DocuSign, and Dollar Shave Club successfully adopted counter-positions, they did not immediately acquire a moat through this alone. Consider the numerous firms that adopted counter-positions and saw their valuations soar in 2021; by 2025, only a handful of these names remain prominent.
However, the strengths from Counter-Positioning can contribute to the formation of a moat. Take Uber, for example, which adopted a counter-position in the taxi industry with its service offering. While this afforded Uber numerous advantages, it did not protect the company from other firms attempting a similar approach. Therefore, more is required to create a moat.
Setting aside the question of whether Uber currently possesses a strong moat, indicators of a moat could be found in Network Effects (connecting supply and demand with its platforms) and Intangible Assets (Uber has become a ubiquitous verb). Moreover, Uber has now achieved substantial scale, suggesting it could also be evaluated through the lens of Cost Advantage.
Thus, these moats (or their indicators) are not directly formed by the powers of counter-positioning but can be positively influenced by them.
The power of Counter-Positioning can positively contribute to the emergence of a moat that will primarily be based on Network Effects, Switching Costs, and Intangible Assets. In some instances, a counter-position may also contribute to Cost Advantage, as exemplified by Amazon's position in the book-selling market in the late 20th century.
Branding —> Intangible Assets
The power of Branding can contribute to a moat based on Intangible Assets. However, Michael Mauboussin and Dan Callahan, in their 2024 Morgan Stanley paper "Measuring the Moat," (2024) posit that brands are not, in themselves, a source of competitive advantage. They support their view by highlighting the weak correlation between brand rankings and the underlying company's Return on Invested Capital (ROIC), as illustrated in the figure below.
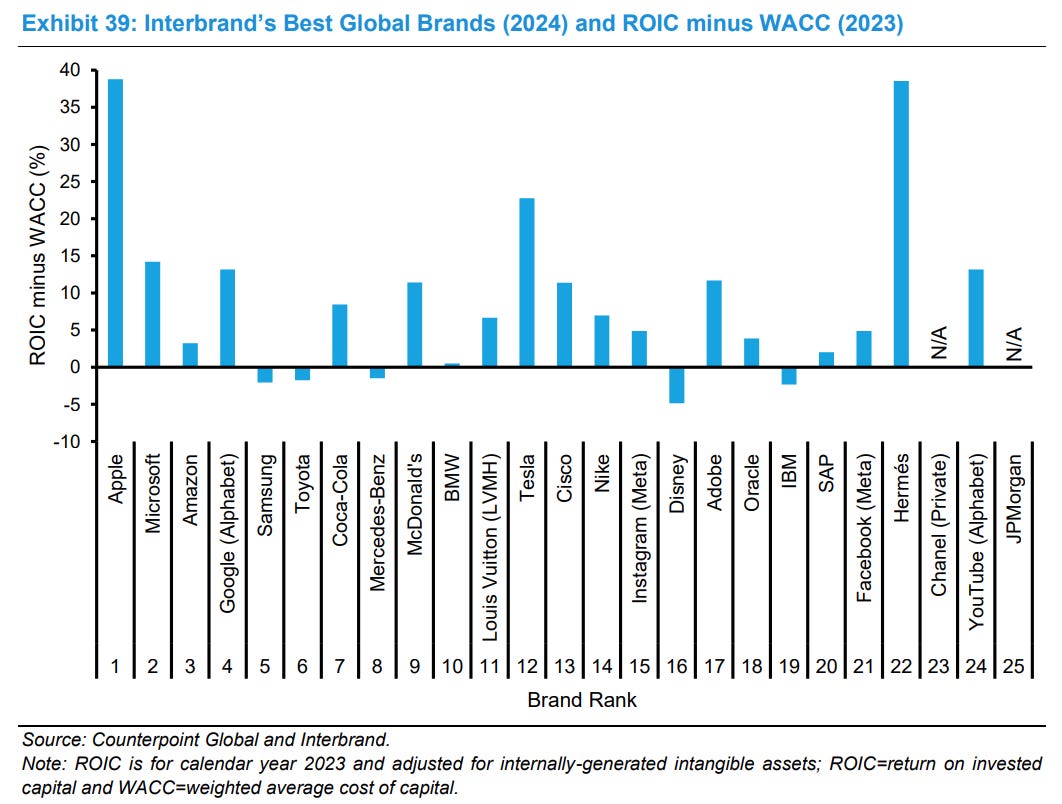
While the figure above represents only a single year (2023), the delta between ROIC and Weighted Average Cost of Capital (WACC) is, in my view, a crucial indicator. When measured over an extended period, it provides a robust assessment of a company's ability to create value.
Another key performance indicator is the turnover ratio of a company’s invested capital. Given that most luxury companies benefit from a degree of engineered scarcity to achieve their ROIC, their long-term value creation will primarily depend on the magnitude of the return they generate on invested capital (ROIC) and its alpha relative to the WACC.
I concur with Mauboussin and Callahan that Branding, in isolation, does not constitute a sustainable competitive advantage. My agreement centers on the concept of durable competitive advantage. While acquiring the brand rights to a powerful brand could generate significant short-term value, future value creation necessitates a broader set of factors beyond the brand itself.
Therefore, in my opinion, the underlying company of a brand must contribute its own unique value to this process for long-term value creation. This could manifest as a distinctive DNA embedded within the company's culture, often developed and refined over a very long period. Hermès, the French luxury company, exemplifies this in my opinion.
In conclusion, a brand, per se, does not constitute a moat; rather, it is the underlying business processes, the intrinsic DNA within the company's culture, and other firm-specific characteristics that enable value extraction from the brand over an extended period—all intangible assets.
Cornered Resource —> Intangible Assets, Efficient Scale
Cornered Resources, such as patents or exclusive access to unique sources, empower a company to create value. When companies create value through research and development, they must adopt a long-term horizon, necessitating continuous investment in future capabilities. In essence, the returns generated by such companies often follow an extended period of research.
Consequently, a single patent does not, in isolation, constitute a moat; rather, it serves as a critical force supporting (or enabling the build-up of) a moat. The crucial element here lies in the internal processes of companies, which, as part of their intangible assets, culminate in expressions like a patent. Multiple patent cycles can subsequently lead to a profitable position within a sector. Only through sustained efforts to strengthen these processes can a moat based on Intangible Assets emerge.
Moreover, Cornered Resources can contribute to the formation of a moat based on Efficient Scale. This typically involves a physical asset such as a mine, airport, harbour, or another uniquely positioned holding. Such assets can establish a mini-monopoly, enabling a company to exert pricing power and achieve above-average returns on invested capital.
Process Power —> Cost Advantage, Intangible Assets
To date, certain companies have undoubtedly leveraged their optimized business processes, often developed over extended periods. However, with the advent of Artificial Intelligence, the extent to which some existing, largely technologically driven, business processes can sustain their advantage from Process Power remains uncertain.
Strengths derived from Process Power have significantly contributed to certain companies building moats based on Cost Advantage (as efficient business processes facilitate gaining scale) and Intangible Assets (a company like ASML boasts a long history of research and development, including the development and streamlining of its internal processes and the knowledge embedded therein).
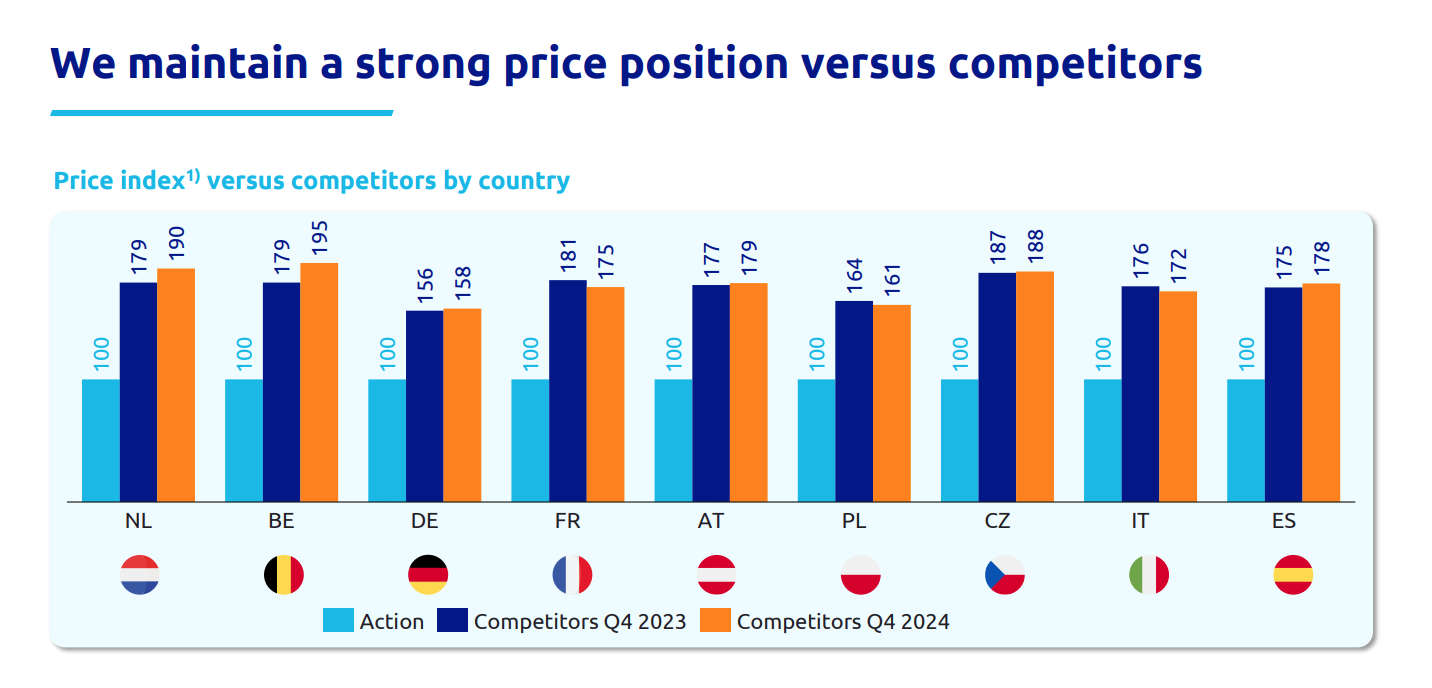
Beyond Process Power alone, other powers are also necessary to form a genuine moat. These include the power of Scale Economies for creating a moat based on Cost Advantage, or Cornered Resources for establishing a moat rooted in Intangible Assets. For instance, Action (3i Group), through its Process Power and Scale Economies, has built substantial scale, now enjoying a strong moat from Cost Advantages. This enables it to compete effectively on price—in Q4 2024, competitors of Action were, on average, 58% to 95% more expensive across 1,500–2,000 comparable SKUs.
A Deep Dive into 3i Group (and Action) is available here:

Furthermore, other relationships within the framework I've outlined above are also possible; moats are, after all, often forged by a combination of powers.
That said, the fundamental underpinnings upon which companies construct their strategic playbooks are largely aligned with the five moat categories I have detailed in this article.
The subsequent paragraph will focus on the quantification of these five moat strategies.
Quantifying Moats
How, then, can we practically identify and assess a company's moat based on the aforementioned insights? Let me preface this by stating that it is a highly challenging exercise; qualitative details regarding company-specific characteristics, competitors and sector-specific knowledge are crucial, as is understanding how, and in what proportion, companies are likely to evolve in the future.
Nevertheless, I have attempted below to briefly illustrate the financial outcomes for companies possessing a particular moat and how investors can quantify these in the companies' financial reporting.
Cost Advantage
Companies with a moat based on Cost Advantage typically exhibit relatively low gross and operating profit margins (as a percentage of revenue). However, due to high volume and a rapid turnover of their invested capital, these firms are capable of generating substantial absolute value despite razor-thin margins.
Consequently, for such companies, you will frequently observe low gross and operating profit margins, but coupled with a comparatively high asset turnover (e.g., inventory turnover), which translates into a higher absolute ROIC (in €, $, etc.) and, by extension, its absolute value creation capabilities.
Relative to industry peers, companies with a Cost Advantage moat will generally demonstrate a higher turnover of their invested capital, sometimes accompanied by slightly higher gross and operating margins—gains derived from cost efficiencies due to their larger scale.
Network Effects
When a company possesses a strong moat based on Network Effects, it will continue to experience an increase in the number of users on its platforms (or at least no structural decline). Furthermore, provided the company effectively monetizes its moat, it should demonstrate a sustained increase in its operating profit margins (excluding financing components) over time. The trajectory of value creation per user [for users] also offers a strong indication of the moat's slope, although this can be more challenging to distill from financial statements.
For Meta Platforms, for instance, the operating profit per user will serve as a key indicator of the company's moat. For a company like Airbnb, we must examine the changes in both the number of hosts and guests on its platform, as well as the increase or decrease in transaction volume (both in number and in €, $, etc.). Subsequently, the profitability Airbnb can achieve on these transactions also provides a crucial indicator.
Switching Costs
Companies with a moat based on Switching Costs must demonstrate the ability to exercise pricing power over their customers without experiencing significant churn.
For these companies, the objective is to discern the drivers of revenue growth and associated profitability, segmenting growth into volume (e.g., new customers, expansions) and pricing power (i.e., price increases). This breakdown is sometimes directly available in companies' financial disclosures. When it is not, we must endeavor to infer this information from management's qualitative commentary on reported figures.
On the income statement, the successful exercise of pricing power should result in a sustained increase in margins over time. Theoretically, revenue growth driven by price increases should be more profitable than growth achieved through volume, as the latter often entails additional costs to attain (e.g., initial customer acquisition costs).
Intangible Assets
Quantifying a moat based on Intangible Assets presents a complex challenge. One might intuitively consider the balance sheet value of intangible assets; however, companies may have already significantly amortized these, even if their brands, for example, continue to deliver price premiums. Additionally, a company might have engaged in numerous acquisitions, with associated goodwill recorded on the balance sheet, which may bear no relation to the intangible assets that enable it to achieve above-average margins.
For companies with a moat rooted in Intangible Assets, I believe the primary focus should be on their ROIC in conjunction with their profit margins, and the trend of both metrics over an extended period. Ideally, one should discern the company's ability to sustain these two KPIs over time, which can indicate the presence of underlying processes related to R&D or other investments designed to yield future returns.
It is crucial to recognize that reported financial figures provide only a quantitative indication of a potential moat's presence. Therefore, thorough qualitative research is essential to determine the actual existence and strength of a company's moat.
Efficient Scale
Moats based on Efficient Scale, often in markets which are largely saturated, you will typically observe limited growth stemming from expansion or scale. Such growth is only possible in unsaturated markets, which would inherently leave the door open for new competitors; a situation only mitigable by government intervention favoring existing entities.
Consequently, for companies with an Efficient Scale moat, the primary focus should be on their pricing power. This can be inferred from an increase in the company's margins and a detailed breakdown of its revenue growth.
Upcoming Article
In the next article, we will explore the investment wisdom of Nick Sleep and Qais Zakaria of Nomad Investment Partners (2001–2014).
Until next time,
Eelze Pieters
© 2025 Massive Moats
Scale Economies Shared
“Most companies pursue scale efficiencies, but few share them. It’s the sharing that makes the model so powerful. But in the center of the model is a paradox: the company grows through giving more back. We often ask companies what they would do with windfall profits, and most spend it on something or other, or return the cash to shareholders. Almost no one replies give it back to customers – how would that go down with Wall Street? That is why competing with Costco is so hard to do. The firm is not interested in today’s static assessment of performance. It is managing the business as if to raise the probability of longterm success.”
— Nick Sleep
A Deep Dive into Costco Wholesale is available here:
A Deep Dive Analysis into Costco Wholesale Corporation

Costco Wholesale's strategy can be summarized as follows: offering a quality assortment of products at the lowest possible price to its members—who pay an annual membership fee—while operating cost-efficiently and aiming for high inventory turnover. The company minimizes its profit margin on merchandise to create the highest possibl…
Disclaimer: NFA / E&OE. The information above is provided for general informational purposes only and should not be construed as investment, accounting and/or financial advice. You should consult directly with a professional if financial, accounting, tax or other expertise is required.
Great reading on business moat.