
A Deep Dive Analysis into 3i Group plc
Unraveling the universe of 3i Group plc ($III.L) and the secrets behind its core holding, Action.


Introduction 3i Group
To many, 3i Group is a relatively unknown company. This is unsurprising, as the investor’s name is rarely encountered. With a team of 223 talented professionals, 3i Group also remains unfamiliar to many consumers in Europe, despite its significant stake in a well-known company: the Dutch retailer Action.
3i Group’s 57.9% stake in Action accounts for 72% of the total implied Net Asset Value (NAV) of 3i Group. Therefore, an investment in 3i Group is, to a large extent, an investment in Action.
The Dutch discount retailer Action has been instrumental in 3i Group’s resurgence from the ashes of the 2009 financial crisis, during which it faced significant challenges and had to dilute its shareholders considerably. Thanks to the support of existing shareholders at the time, 3i Group persevered, enabling it to secure one of Europe’s most successful private equity deals in 2011: acquiring a majority stake in Action.
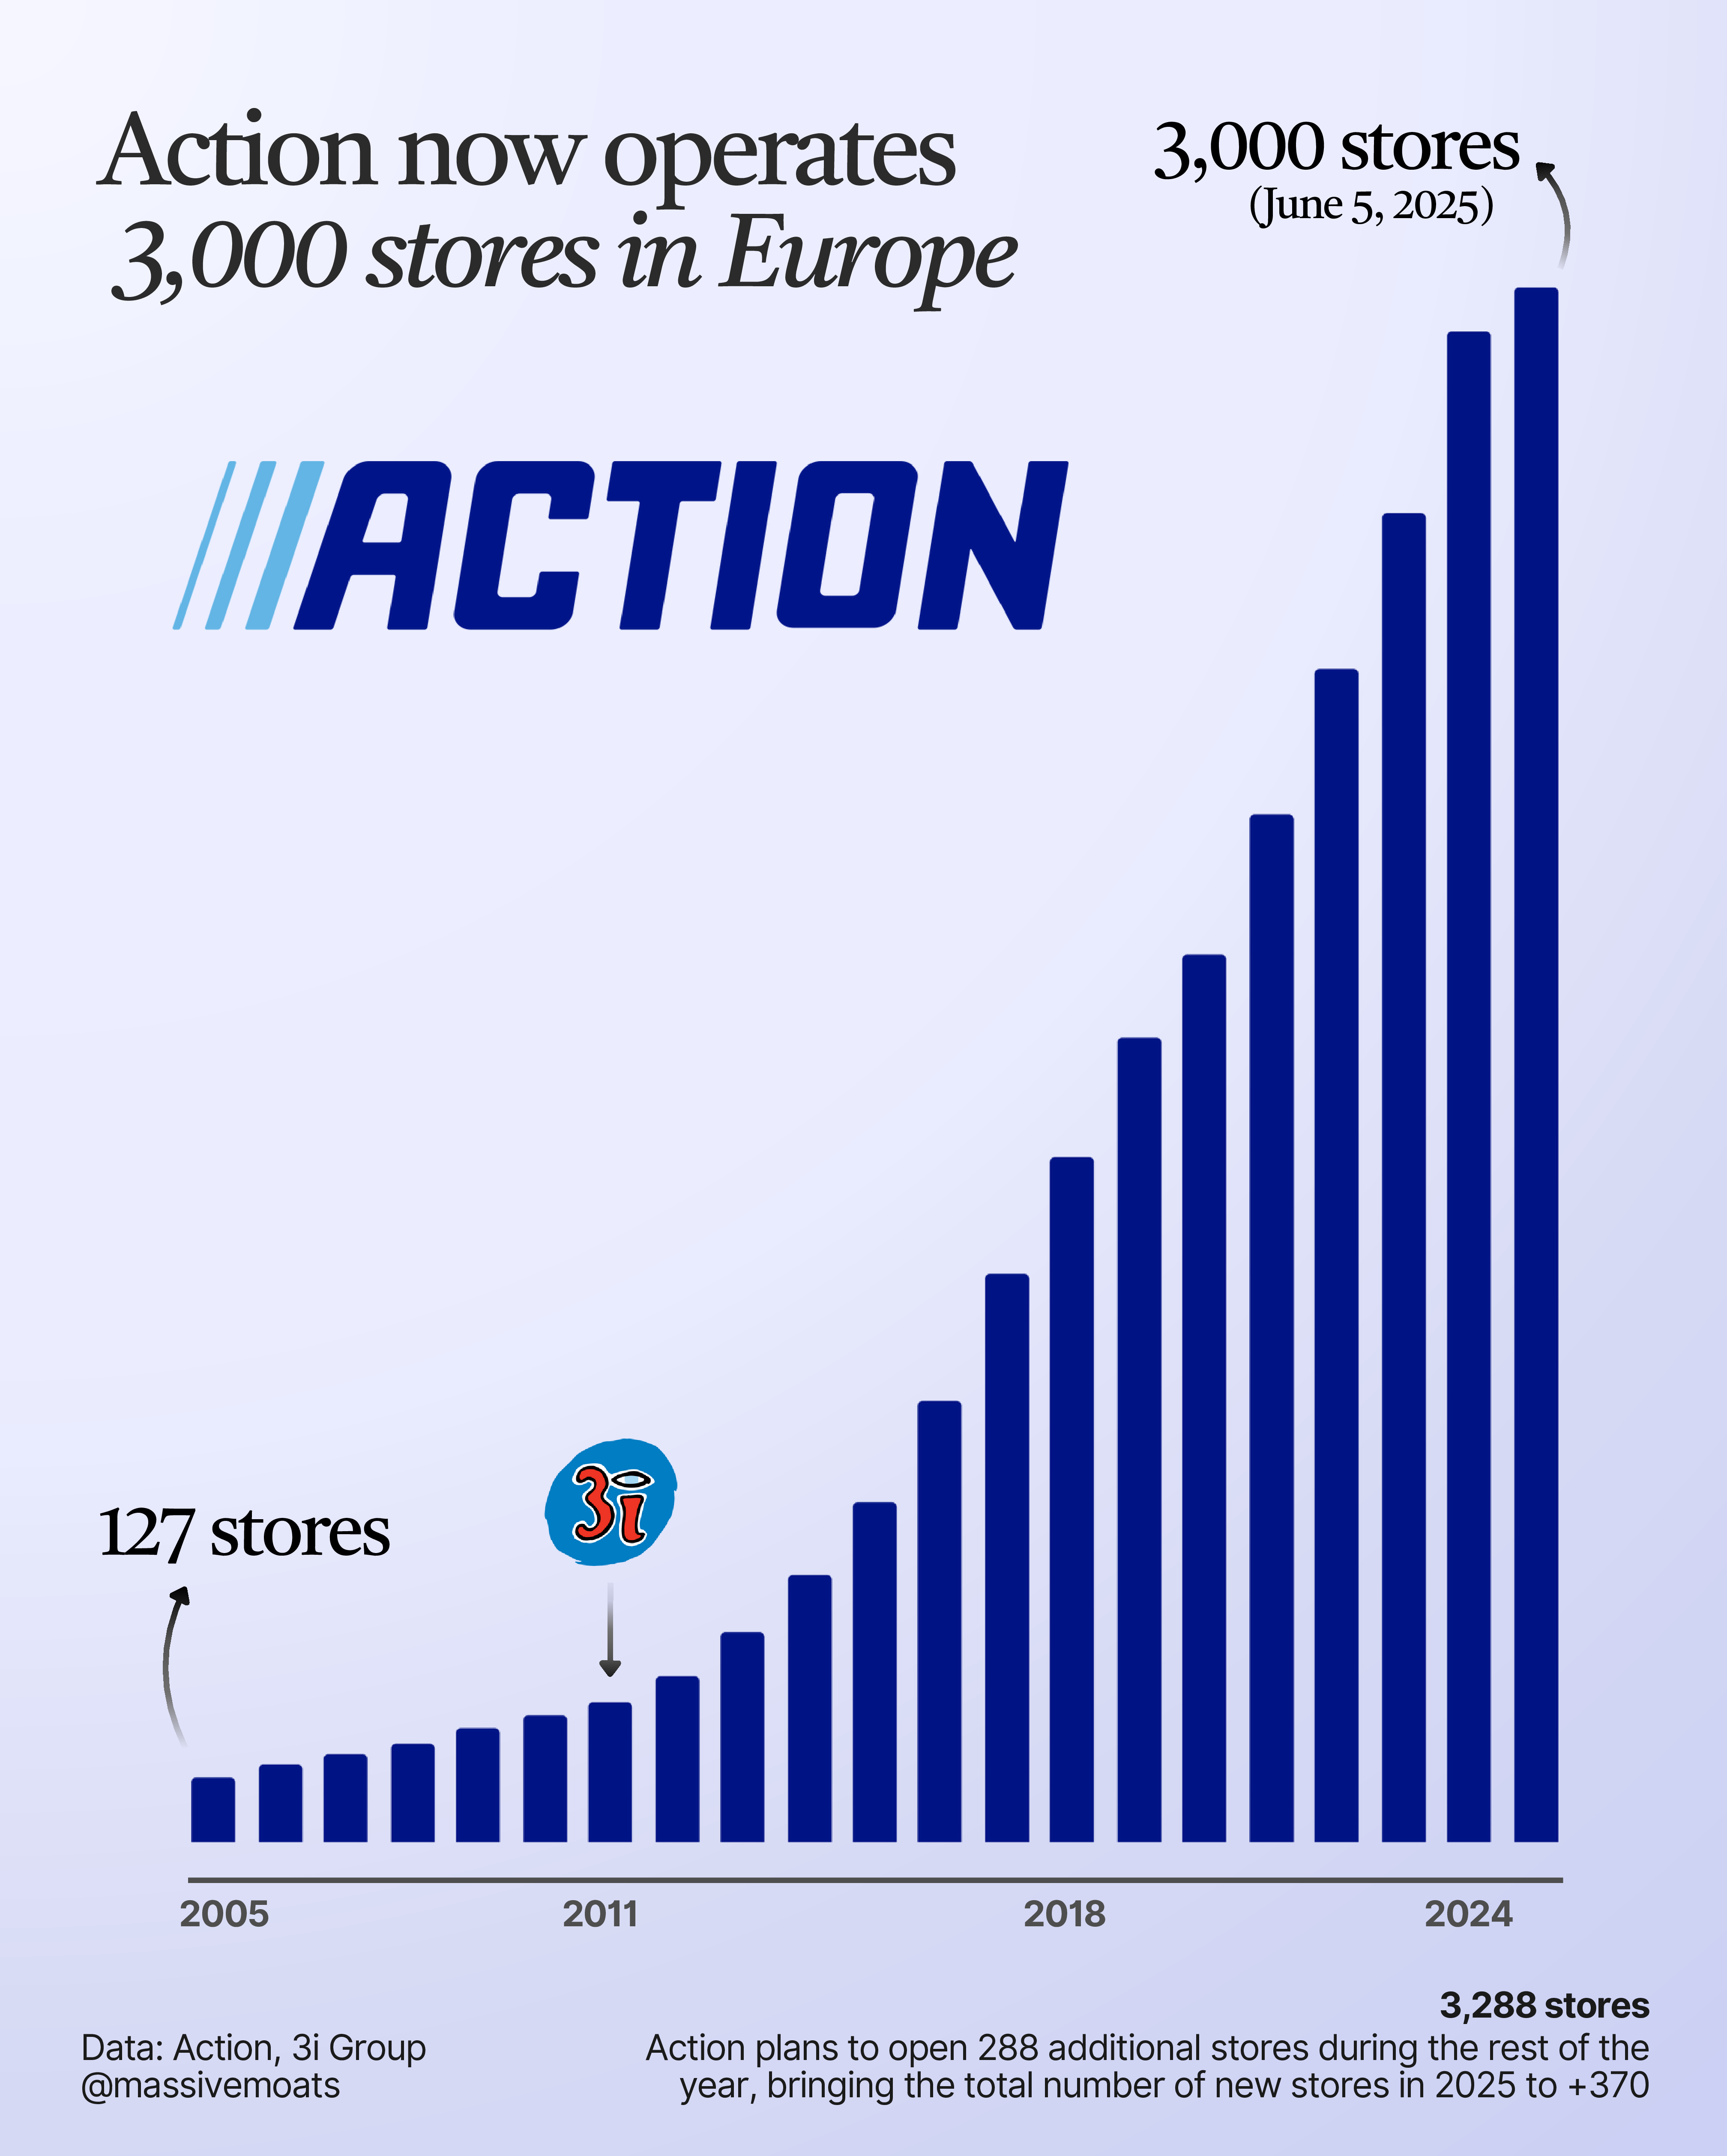
Under 3i Group’s leadership, Action has pursued significant expansion across Europe. From 269 stores in the Netherlands, Belgium, and Germany in 2011, it has since opened over 2,700 new stores across 12 European countries, serving more than 18.7 million customers weekly. This is a remarkable success story of Dutch origin, bolstered by British expertise.
Over a decade later, this partnership has proven to be a winning combination: 3i Group’s share price has risen significantly in recent years. This presents an opportune moment to explore 3i Group and Action in greater depth and reflect on this remarkable success.
I wish you an insightful read,
Eelze Pieters
Founder of Massive Moats

This deep dive is provided free of charge as a resource for everyone. For those who wish to support my work, a downloadable PDF version of this deep dive is available for purchase here: massivemoats.com
Chapter 1 | The History of 3i Group
To trace the origins of 3i Group, we must return to the 1940s in the United Kingdom. Shortly after the end of World War II, the predecessor of 3i Group was established: the Industrial and Commercial Finance Corporation (ICFC). The ICFC was founded by the Bank of England, in collaboration with the Treasury and several British banks (Copey & Clarke, 1995).
The ICFC was created to facilitate long-term investments for small and medium-sized enterprises (SMEs). In the years following World War II, the supply of capital was significantly insufficient to meet demand. The ICFC’s initial capital of £15 million (3i Group, 2025) was intended to complement the services provided by banks at the time. While banks primarily focused on providing loans for working capital, the ICFC’s capital was used to acquire long-term assets.
The ICFC was established to serve small and medium sized businesses through the provision of long term and permanent capital (typical investments of £5,000-£200,000). — 3i Group (2013)
Alongside the ICFC, the Finance Corporation for Industry (FCI) was also established, focusing on large corporations. In 1973, the ICFC and FCI merged to form Finance for Industry (FFI), which was later renamed Investors in Industry, or III—3i—in 1983 (Merlin-Jones, 2010).
In June 1994, 3i Group went public through an initial public offering (IPO). At that time, its owners—the Bank of England and several British banks—reduced their ownership by 45% through the IPO (Upi, 1994).
By then, 3i Group held investments in 3,400 companies, with a total portfolio value exceeding £2.5 billion. The highlights of the British investment company’s history are presented in the image below (3i Group, 2024).
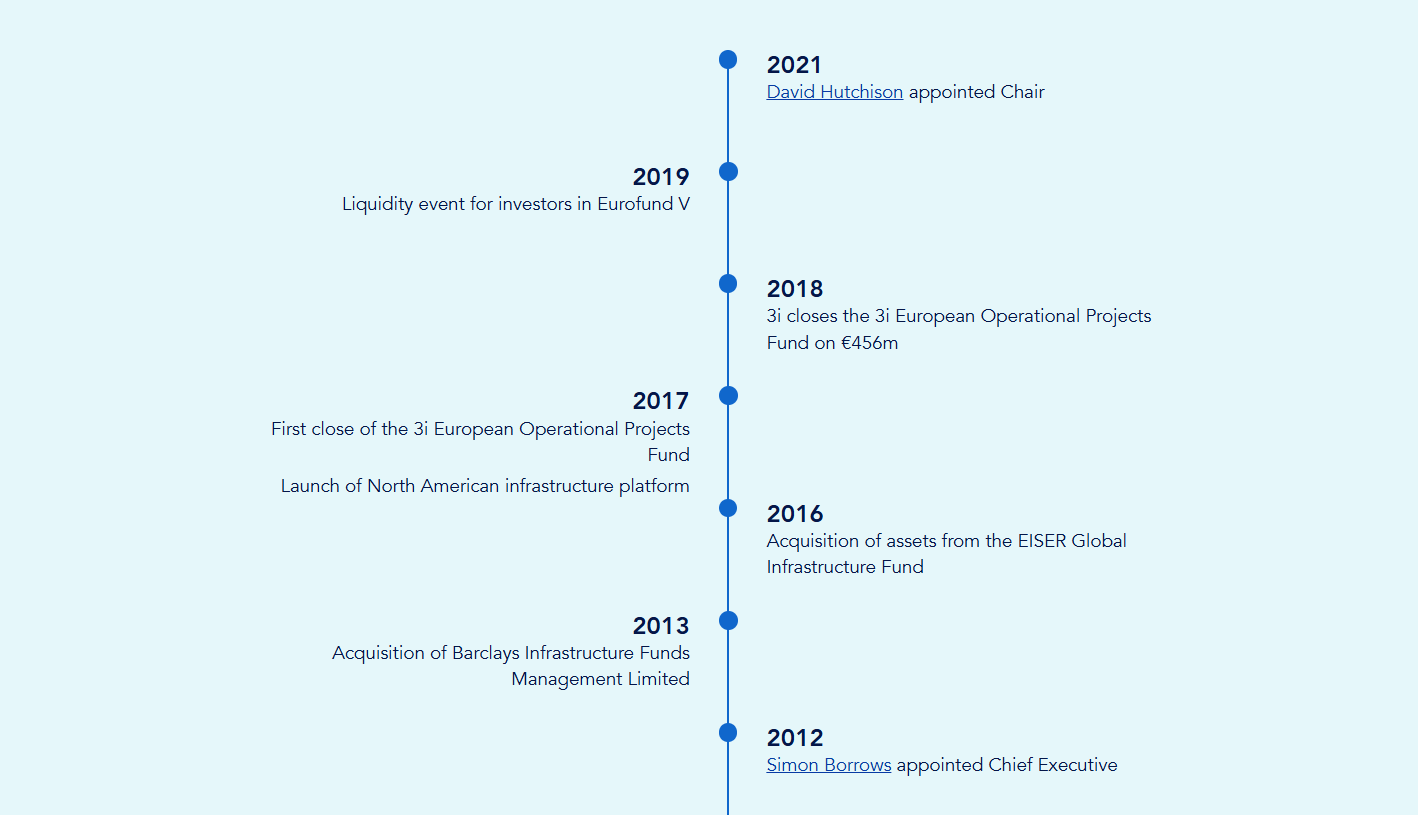
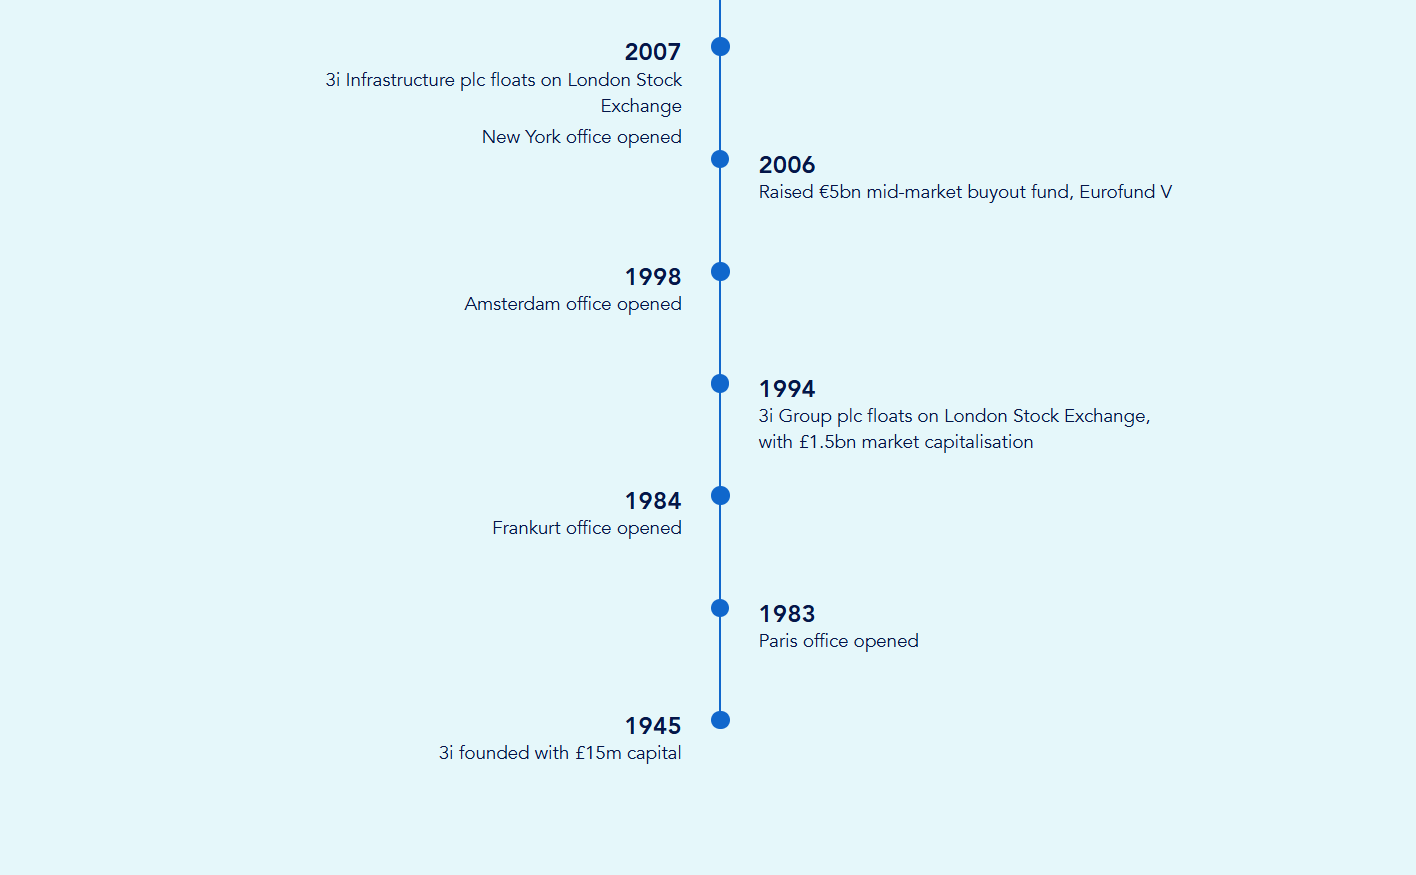
While the predecessors of 3i Group initially focused on stimulating the British economy by providing long-term capital to businesses, 3i Group later expanded internationally, opening offices in Paris (1983), Frankfurt (1984), Singapore (1997), Amsterdam (1998), China and India (2005), New York (2007), and Brazil (2011) (3i Group, 2013; 2025).
The firm invested both its own capital on its balance sheet, as well as funds raised from investors through its managed funds, primarily to execute leveraged buyouts. However, following the 2008 financial crisis, 3i Group faced severe challenges. The company was overly leveraged, resulting in its NAV plummeting from £10.77 on March 31, 2008, to £4.96 on March 31, 2009 (diluted net asset value per ordinary share).
Leveraged Buyouts
A leveraged buyout (LBO) is the partial or full acquisition of a company, where a significant portion of the purchase price is financed through borrowed funds, with only a small portion contributed from equity. LBOs enable investment firms to undertake larger acquisitions with less committed capital. If the acquisition performs well and yields returns higher than the cost of the borrowed funds, the investor achieves amplified returns through this leverage. However, the downside is that if investment returns underperform, the debt burden can become unsustainable, leading to financial distress.
Net Asset Value (NAV)
The Net Asset Value (NAV) represents the net value of the assets of an investment company, typically expressed per share (NAV/share or simply NAV). This metric is calculated by summing the value of the company’s portfolio investments. These values may be estimated by the investment firm or aligned with market valuations for stakes in publicly listed companies. Cash holdings are added, and total debt is subtracted from this total. Further details on NAV are provided in the Valuation chapter.
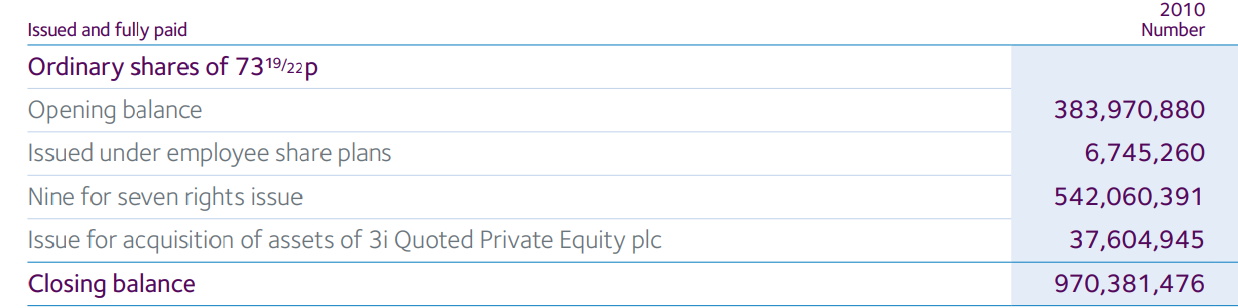
The high leverage proved unsustainable for 3i Group, forcing the company to raise additional capital in 2009 through a share issuance. It issued over 523 million new shares via a 9-for-7 rights issue (3i Group, 2009), allowing existing shareholders to purchase 9 new shares for every 7 shares held at the issue price. Shareholders who did not participate saw their ownership diluted. As a result, the number of outstanding shares increased by 542 million, reaching 970 million by March 31, 2010.
Additionally, 3i Group was compelled to divest its Venture Capital (VC) division, which focused on European VC investments, for approximately £130 million (Reuters, 2009). This marked its withdrawal from early-stage investments (Reuters, 2009).
The events surrounding 3i Group in 2008 were unfortunate. For long-term investors, crises often present opportunities for targeted investments. Nevertheless, this challenging period was a necessary turning point for 3i Group. By critically reflecting on past mistakes and learning from them, the company was able to reinvent itself—and with remarkable success.
Following the significant share issuance in 2009 and the appointment of Simon Borrows as Chief Investment Officer in October 2011—later announced as CEO in May 2012—3i Group embarked on a transformative journey:
We have made significant progress in the turnaround of 3i and this is demonstrated by our strong results. We are only one year into our three year strategic plan and there is plenty more that we are doing to drive performance and generate further shareholder value. — Simon Borrows (2013)
In addition to this three-year strategic plan, new frameworks were established for the company’s risk management:
Last year [2012], we implemented a new vintage control policy for the Group’s own balance sheet investments. This is designed to minimise the risk of overinvesting at the top of the private equity cycle in the future. In addition to monitoring investment and capital allocation within Private Equity, we have extended this approach to the rest of the Group and have combined it with our broader risk management framework which assesses and monitors other key risks for the Group. This forms part of our refined risk management approach which is more closely linked to our new strategic objectives. — 3i Group (2013)
In the years following the financial crisis, 3i Group underwent a thorough restructuring. Amid the ensuing turmoil, the company made a pivotal investment that would largely define its future success: Action. A simple press release on June 30, 2011 marked the starting point of a value creation worth tens of billions. This investment enabled 3i Group to rise like a phoenix from the ashes.
We look forward to working closely with the company [Action] to further develop and grow the business whilst maintaining its current entrepreneurial culture. We will help Action grow by opening new stores in the Netherlands, Belgium and Germany. We are present in these and other markets, and will use our knowledge, experience and network in Europe and the rest of the world to support Action. 3i is very excited about this investment. — 3i Group (2011)
With its 2011 investment in Action, 3i Group gained significant momentum, rewarding shareholders with a rapidly increasing intrinsic value of the company.
However, for those who invested during the 1994 IPO, the journey was not always smooth. The figure below illustrates the rollercoaster ride of 3i Group’s share price.
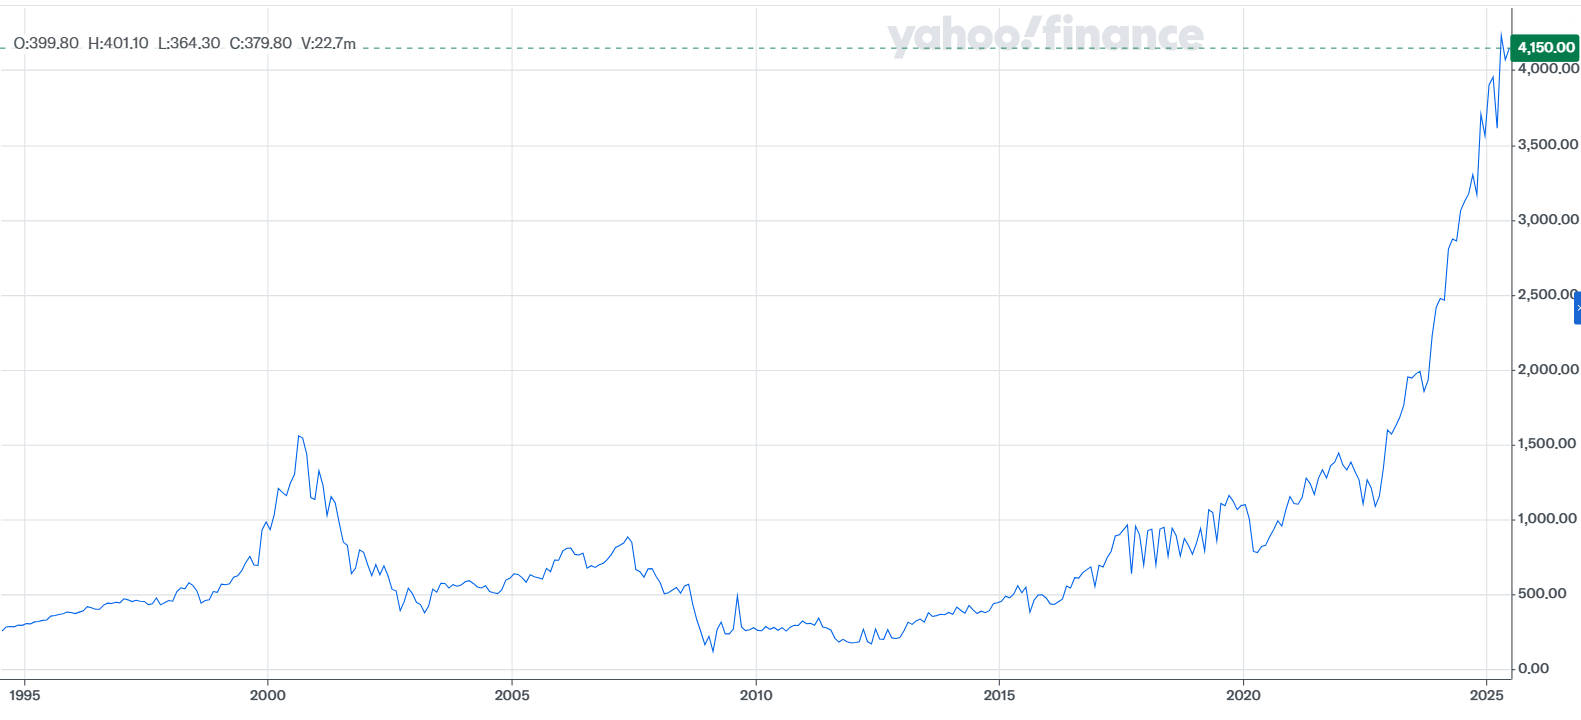
In September 2000, the share reached its then all-time high (ATH), only to plummet to its all-time low (ATL) eight years later, trading at over 90% below its 2000 peak.
Historical Returns
In 1994, 3i Group went public with an introductory price of 272 pence per share. At the time, the NAV per share was 314.40 pence, offering investors a 13.5% discount on the NAV (The New York Times, 1994).
Since the 1994 IPO, 3i Group shares have delivered a CAGR of 9.3% to its original shareholders. This figure reflects only share price appreciation, excluding the (special) dividend payments made since 1994.
Compound Annual Growth Rate
The Compound Annual Growth Rate (CAGR) represents the annualized growth rate of an investment over a specified period. As annual value changes can vary, and simply averaging these changes would provide an inaccurate picture, the CAGR accounts for the effects of compounding; the exponential growth.
It is calculated as follows:
CAGR =(End Value/Beginning Value)^(1/#years)-1
As of June 8, 2025, the share price of 3i Group is 4,265 pence. The NAV per share as of March 31, 2025, was 2,542 pence, representing a premium of 68% over the NAV.
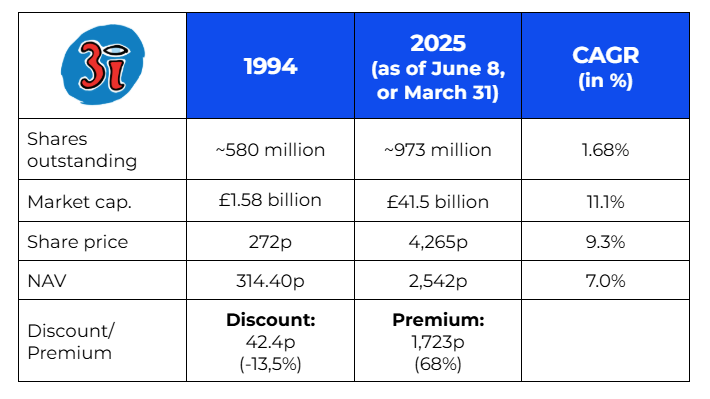
Since 1994, 3i Group’s NAV has grown at a CAGR of 7.0%. With a share price return of 9.3% CAGR, this reflects an increasing premium of 3i Group’s market value relative to its NAV.
While investors at the time of the IPO could acquire shares at a 13.5% discount to the NAV, by June 2025, this has shifted to a premium of 68%.
Whether this significant premium of over 60% above 3i Group’s implied NAV is justified, will be explored in the chapter regarding 3i Group’s valuation. But first, we will delve deeper into 3i Group and its portfolio holdings.
Chapter 2 | Strategy
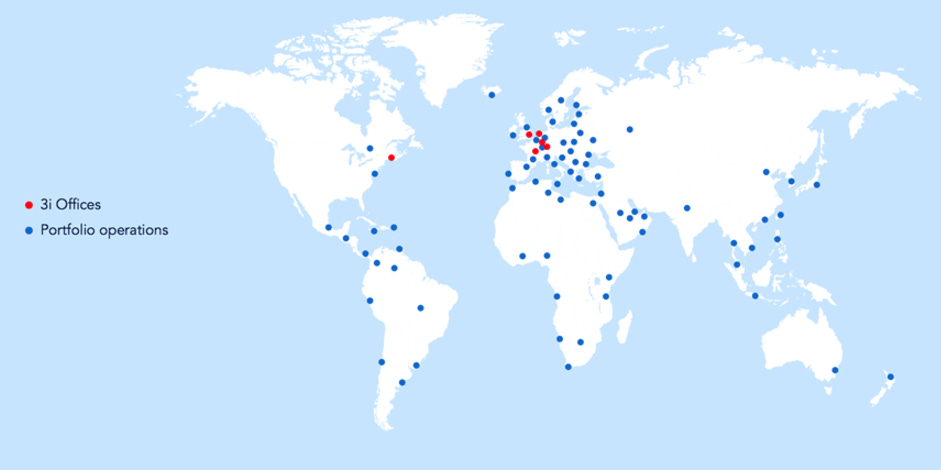
3i Group appears to have learned from the lessons of the period surrounding 2008. The company now focuses on businesses headquartered in Europe or North America (3i Group, 2025), while these businesses may operate globally. Through its portfolio companies, 3i Group indirectly maintains a global footprint, with operational activities spanning the world (3i Group, 2025).
2.1 | Long-term horizon
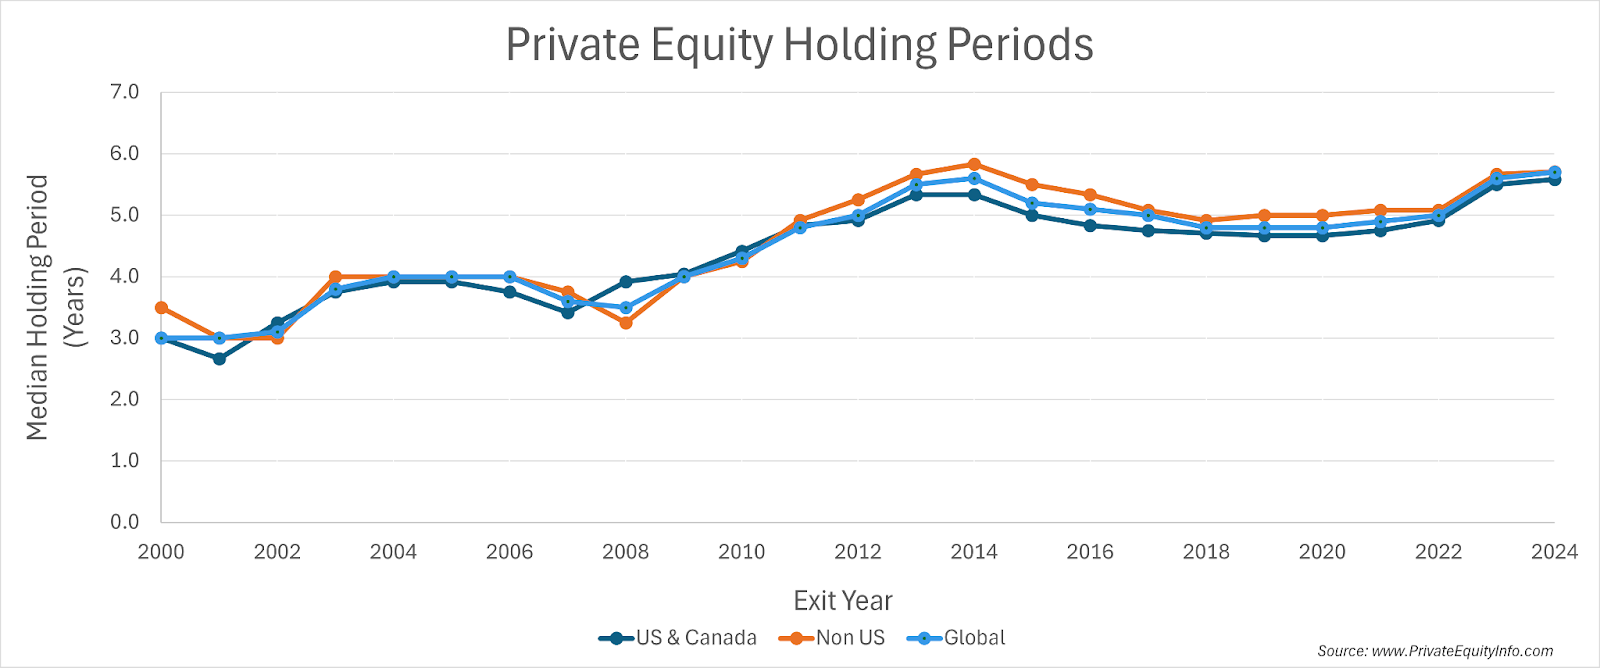
While most private equity firms have an average holding period—the duration for which a portfolio stake is held—of 5.7 years (Private Equity Info, 2024), 3i Group significantly exceeds this. For instance, it has held its stake in Action for 14 years now, choosing to expand its ownership in the Dutch retail chain rather than realizing profits.
Private Equity Info’s research on the average holding period from 2000 to 2024 is illustrated in the chart below. Their findings also indicate that it typically takes private equity firms 4–6 years to recover from macroeconomic shocks. This is largely because most private equity firms invest cyclically, following market sentiment. In down markets, they tend to hold their investments longer, as the prices they can obtain for their stakes are generally lower.
In contrast to other private equity firms, 3i Group explicitly emphasizes a long-term investment horizon:
We aim to compound value over time by investing in mid-market companies to create a diverse portfolio with strong growth potential. [...] Our proprietary capital affords us a medium to long-term investment horizon. We aim to compound our proprietary capital value through conviction in our best investments. — 3i Group (2025)
By exclusively investing its own capital in new companies (i.e., no longer using funds raised from third parties), 3i Group has full control over its investment timeline.
Over the years, 3i Group’s management has successfully implemented its renewed strategy within the company. However, changing a corporate culture is a multi-year process, including shifting employees’ mindsets to focus on the long term. Today, 3i Group takes pride in its people:
Our international teams are formed of local people with great knowledge and experience of their geography and sector. We view diversity as a strength and a plurality of perspectives enhances our origination, value creation and decision making. — 3i Group (2024)
2.2 | Geography & Sectors
We generate attractive returns for our shareholders and co-investors by investing in private equity and infrastructure assets. As proprietary capital investors, we have a long-term, responsible approach. We aim to compound value through thoughtful origination, disciplined investment and active management of our assets, driving sustainable growth in our investee companies. — 3i Group (2025)
The above paragraph is sourced from 3i Group’s annual report for the fiscal year 2025 (p. 3), covering the period from April 1, 2024, to March 31, 2025. This vision is reflected in 3i Group’s strategy, which can be summarized as allocating capital for the long term in mid-sized companies with an enterprise value typically ranging from €100 million to €500 million (at the time of acquisition) in its core markets of Europe and North America (3i Group, 2024, 2025).
Enterprise Value
The enterprise value (EV) of a company can be calculated by taking its market capitalization—determined by multiplying the number of outstanding shares by the share price—and then subtracting cash and adding debt.
For non-publicly listed companies, the enterprise value represents the total implied, self-estimated value of the business, including its net cash or debt position.
A detailed explanation of the enterprise value calculation is provided in the valuation section of this deep dive.
The objective of 3i Group is to enhance the value of investments through organic growth and growth via acquisitions.
We create value from the portfolio through active asset management and organic and acquisition growth. — Simon Borrows, CEO (2025)
In this context, 3i Group aims to create additional value through acquisition-driven growth, as well as fostering organic growth in its portfolio companies. These portfolio companies may, in turn, pursue their own acquisitions, with 3i Group playing an advisory and guiding role, and often screening the market for new add-on acquisition candidates. This approach is commonly referred to in industry jargon as a buy-and-build strategy.
Buy-and-build strategy
A buy-and-build strategy is one of the merger and acquisition (M&A) strategies pursued by a private equity firm. This strategy involves a private equity investor acquiring a portfolio company to serve as a platform for subsequent acquisitions (known as add-ons). These add-ons are integrated into the platform company, which is used as a foundation to expand within a specific segment of an industry.
3i Group adopts a medium- to long-term investment horizon (2025, p. 16). It seeks to acquire significant stakes, typically securing a majority or substantial minority interest, often accompanied by one or more board seats.
3i Group focuses on its sectors Consumer & Private Label, Healthcare, Industrial, and Services & Software. The company describes its approach as broad and flexible, yet investing solely in businesses that can capitalize on long-term structural growth trends (2025, p. 16).
The investor is also highly selective, making only a limited number of investments annually in sectors where it has established expertise and networks (2025, p. 16). As of March 31, 2025, 3i Group employs 223 people worldwide, describing its culture as ambitious, rigorous and energetic, built on principles of respect, integrity, and accountability (2024, p. 19).
As a publicly listed investor, 3i Group’s long-term objective is to generate attractive returns on invested capital, thereby growing shareholders’ capital through the value creation it facilitates.
We will only deploy capital and realise assets when we feel we are achieving optimal value for our shareholders. — David Hutchison, Chair Board of Directors (2024, p. 5).
After acquiring a stake in a company, 3i Group collaborates on its growth plans, acting not only as an investor but also as an advisor and strategic partner. This often involves securing a board seat or restructuring the portfolio company to optimize its growth trajectory, always with a focus on long-term value creation for 3i Group’s stakeholders.
Once invested, we work closely with our portfolio companies to deliver ambitious growth plans and aim to compound value from our best investments over the longer term. — 3i Group (2025, p. 21)
Chapter 3 | Portfolio 3i Group
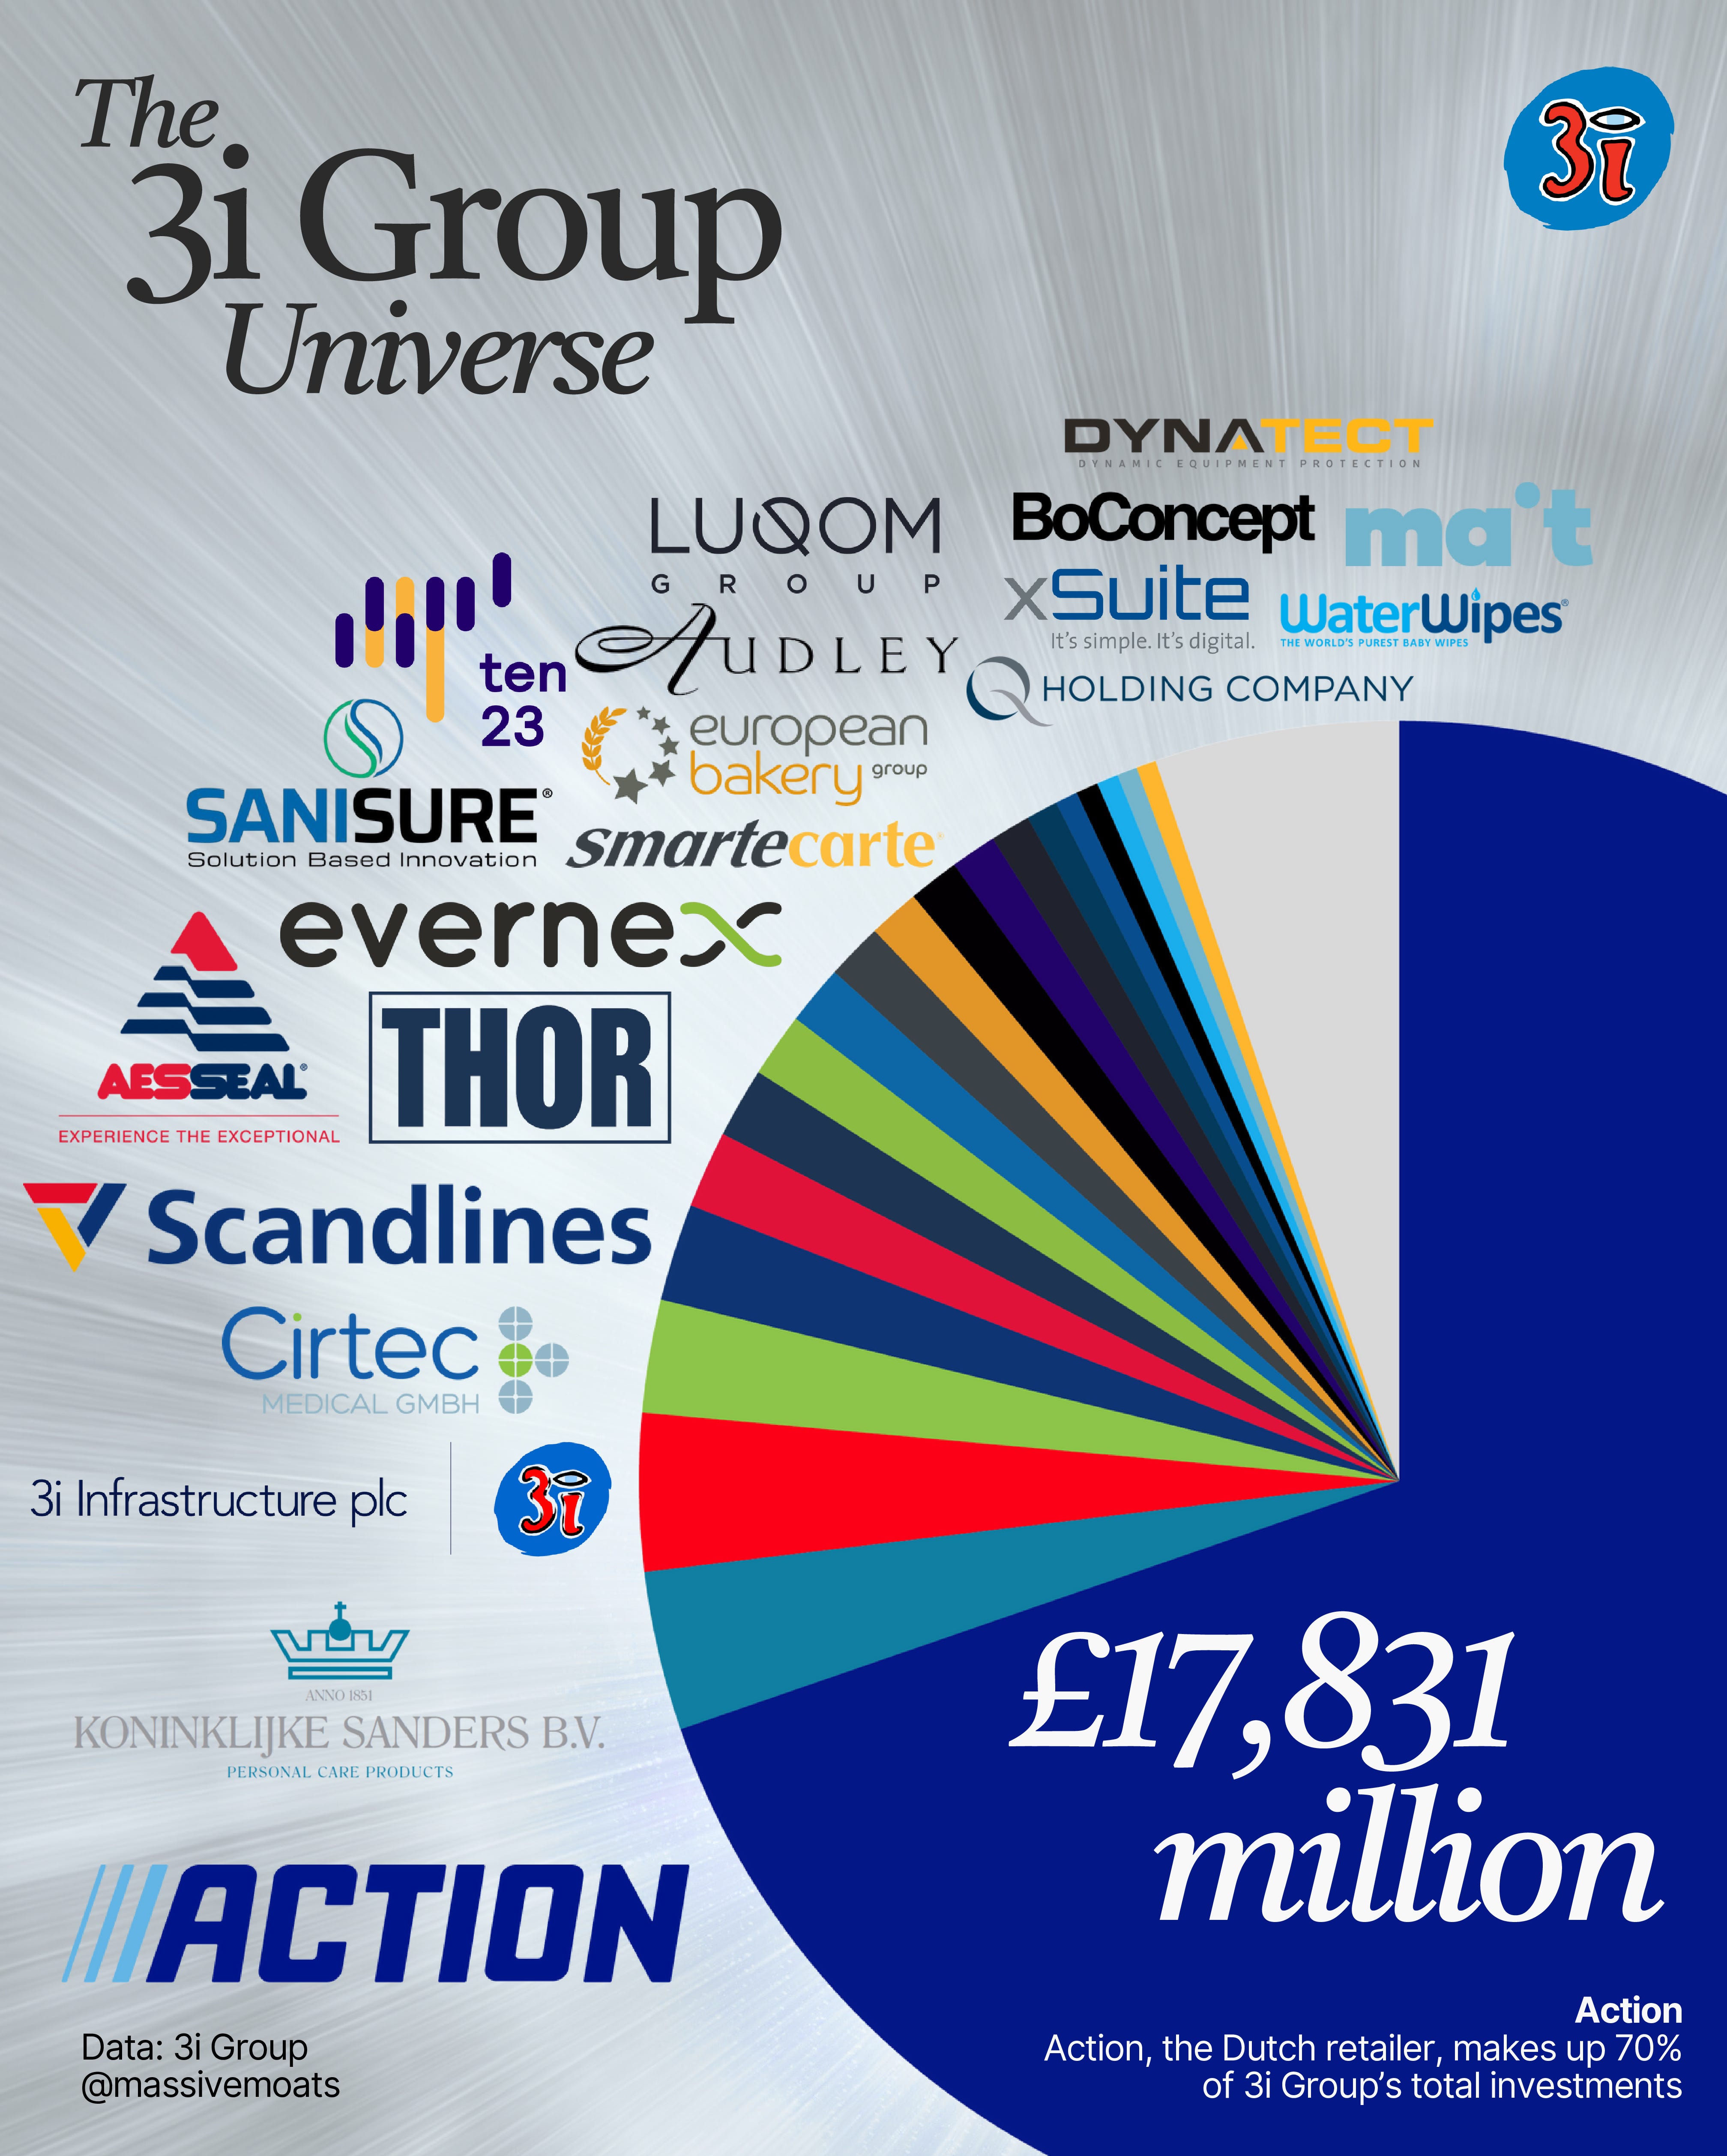
The portfolio of 3i Group comprises three main components (valued as of March 31, 2025):
Private Equity (£23.6 billion);
Infrastructure (£1.5 billion);
Scandlines (£0.5 billion).

Below is an overview of 3i Group’s 20 largest holdings, derived from 3i Group’s Annual Report over FY2025.
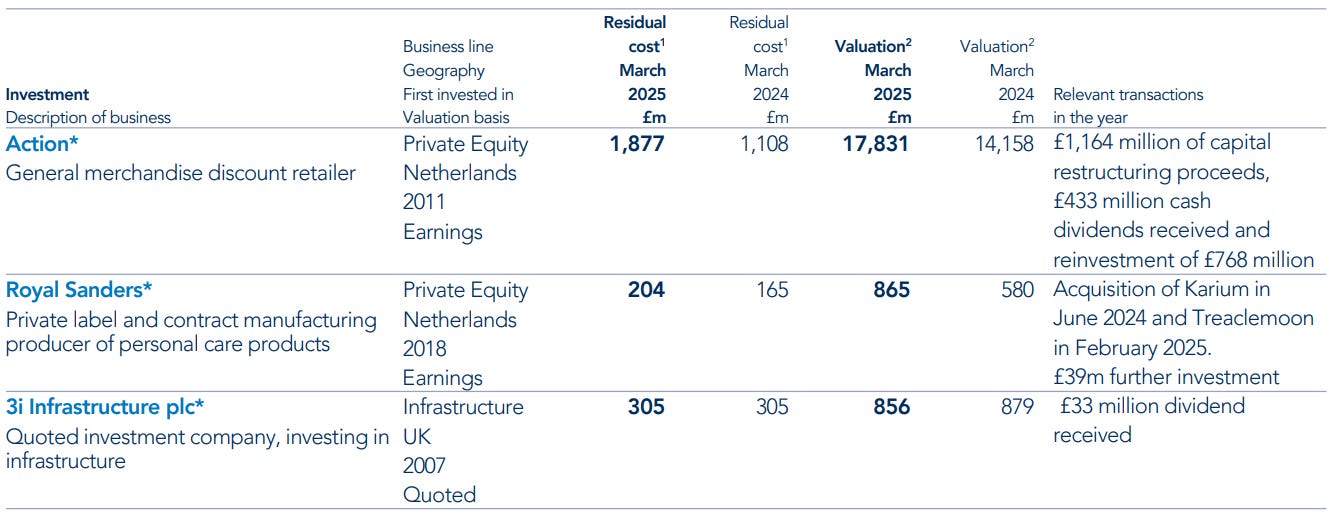
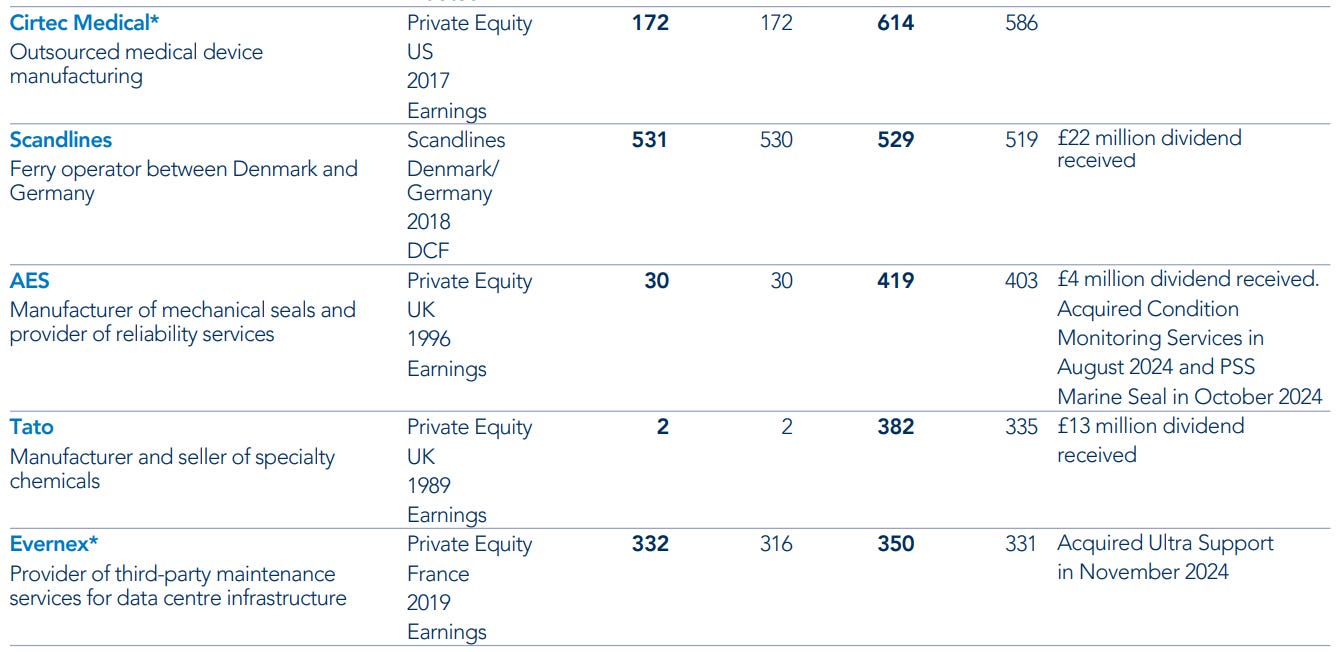
Over 90% of the total portfolio value is represented by the Private Equity portfolio. The majority of this portfolio’s value is derived from Action, which has an implied value of £17.8 billion. More on this later. Let us begin by examining the smaller holdings, 3i Infrastructure and Scandlines.
3i Infrastructure (£1,492 million) comprises a 29% stake in the publicly listed 3i Infrastructure (ticker: 3IN.L), valued at £856 million (based on the closing price as of March 31, 2025), as well as an investment in the portfolio company Smarte Carte (valued at £308 million using a discounted cash flow method) and £328 million in other infrastructure funds. The latter includes investments in infrastructure companies across Europe and North America, spanning the sectors of Communications, Energy, Social Infrastructure, Transport & Logistics, and Utilities (3i Infrastructure, 2025).
3i Infrastructure went public in March 2007 (3i Infrastructure, 2007). Its objective is to deliver an annual return of 8–10% for its shareholders (3i Infrastructure, 2025).
Since its IPO, 3i Infrastructure has achieved a Total Shareholder Return of 10.9% CAGR, compared to 6.0% CAGR for the FTSE 250 Index (3i Infrastructure, 2025). Currently, 3i Infrastructure holds 11 companies in its portfolio, each weighted between 3% and 17% (3i Infrastructure, 2025).

Scandlines (£529 million) represents a 35% stake in the eponymous ferry operator between Germany and Denmark. In 2018, 3i Group sold its Scandlines holding (partially from its Eurofund V fund) for €1.7 billion to First State Investments and Hermes Investment Management (3i Group, 2018). Subsequently, it reacquired a 35% stake to support further growth and sustainability initiatives for the ferry operator.
In early 2018, Scandlines was valued at £1,204 million in its entirety. As of March 31, 2025, its implied value stands at £1,511 million, reflecting a CAGR of 3.2% (from January 1, 2018, to March 31, 2025, excluding dividends received). Since this transaction, Scandlines has been recorded as a separate investment in 3i Group’s books, alongside its Infrastructure and Private Equity portfolios.
While 3i Infrastructure and Scandlines account for 5.8% and 2.1% of 3i Group’s total investment value, respectively, the Private Equity portfolio constitutes the majority, representing 92.1%.
3i Group Private Equity (£23,558 million)
The Private Equity portfolio of 3i Group can be broken down into the following sectors, with values as of March 31, 2025 (and the number of portfolio companies):
Action (Consumer): £17,831 million (1);
Consumer & Private Label: £2,498 million (12);
Healthcare: £1,361 million (4);
Industrial: £915 million (5);
Services & Software: £953 million (14);
(In previous 3i Group reports, Services and Software were sometimes referred to separately or collectively as Business & Technology Services, Industrial was listed as Industrial Technology, and Consumer & Private Label was referred to as Consumer.)
A schematic view is provided below:

Action accounts for 76% of the Private Equity portfolio. Given that the Private Equity portfolio represents 92.1% of 3i Group’s total investment value, Action constitutes 69.7% of all 3i Group’s investments.
The total Private Equity portfolio of 3i Group comprises 36 portfolio companies. Together with Infrastructure and Scandlines, it forms the portfolio allocation of 3i Group, as displayed in the visual on the next page.
3i Group → Action
72.5% of 3i Group’s total implied NAV is attributed to its 57.9% stake in Action. Consequently, an investment in 3i Group is, to a significant extent, an investment in Action. When considering that the premium currently paid for 3i Group shares on the stock market is likely largely attributable to Action, the Dutch retailer accounts for an even higher weighting.
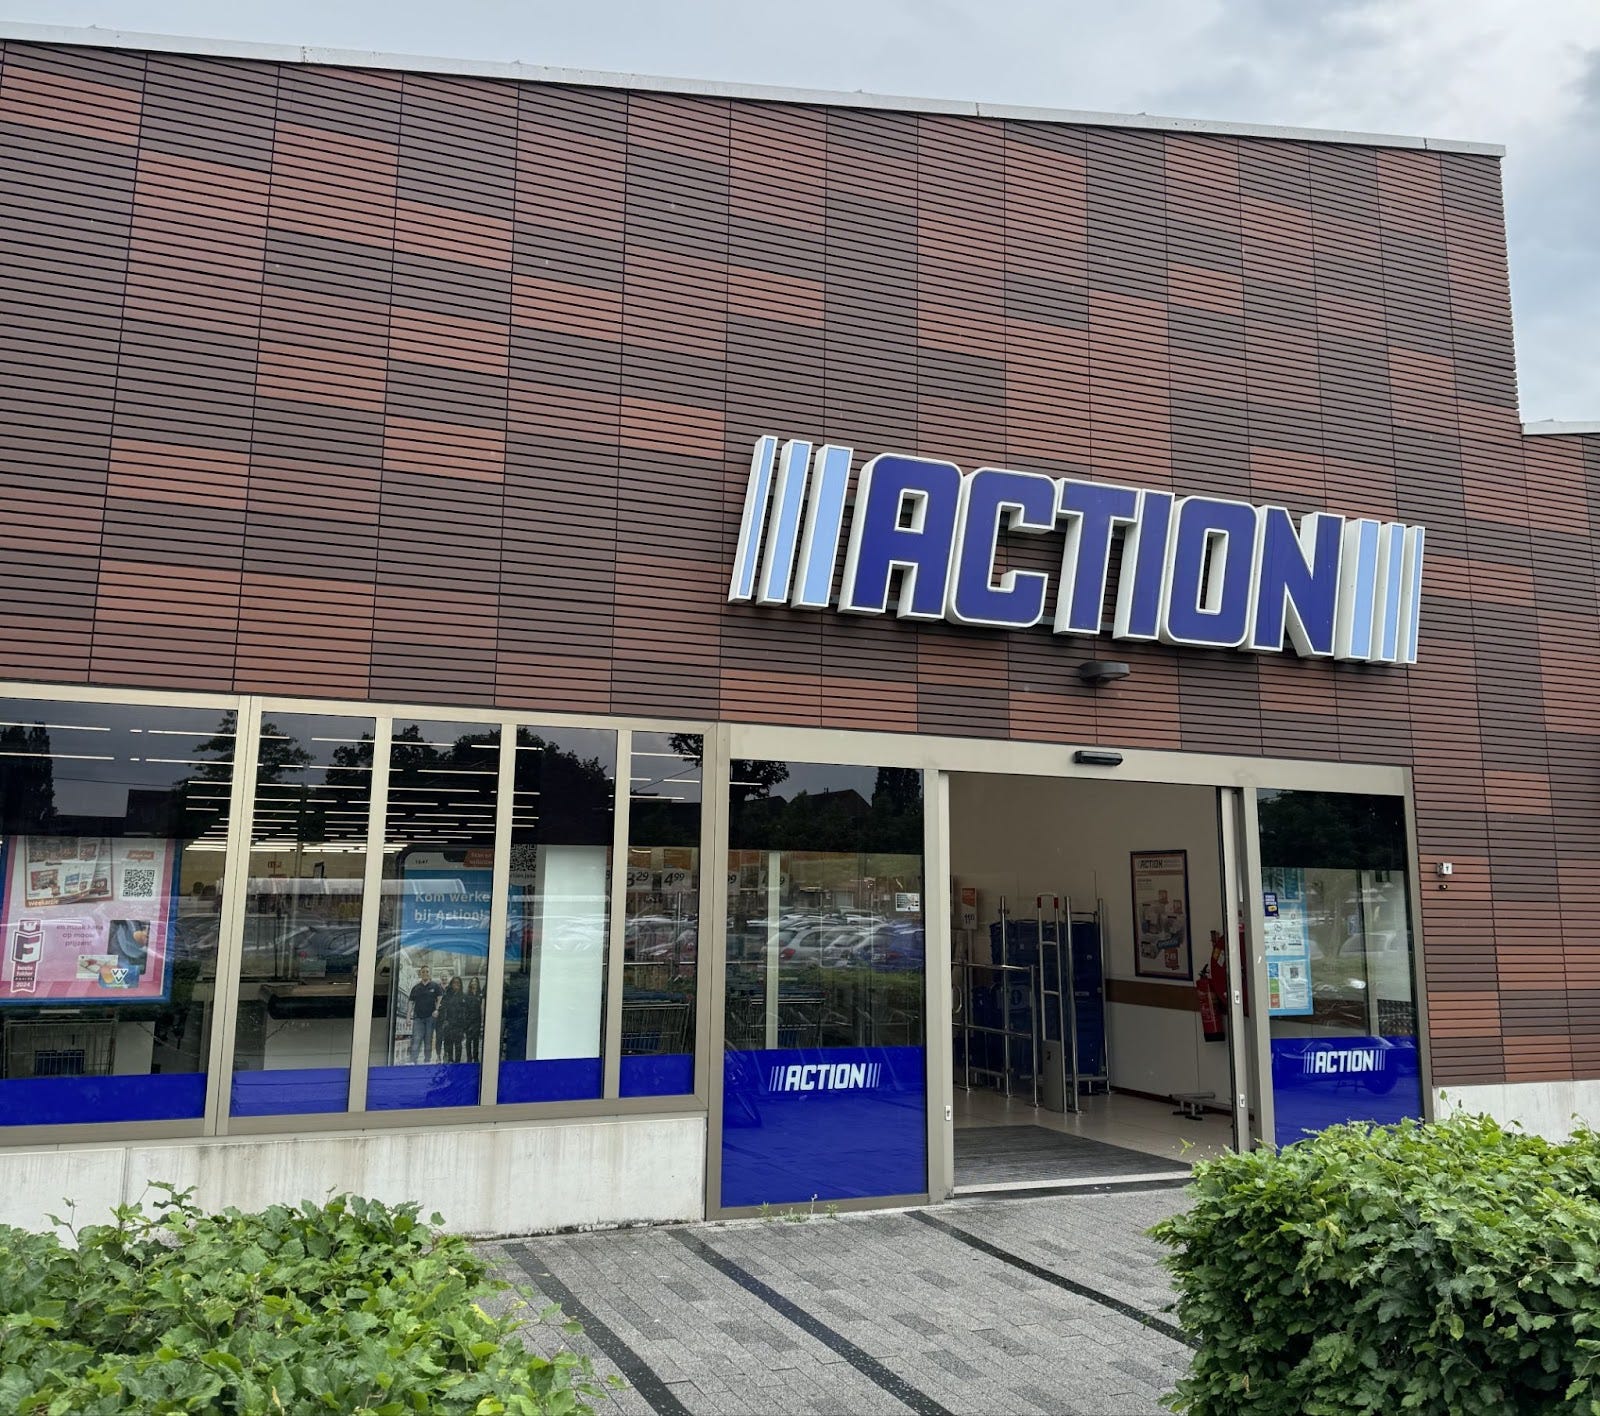
With 3,000 stores across 12 European countries, serving 18.7 million customers weekly, Action has become a resounding success for 3i Group.
Chapter 4 | Action
4.1 | The Origin of Action
To trace the origins of Action, we must go back to the Dutch village of Enkhuizen in 1993, in the province of North Holland (The Netherlands). Here, Gerard Deen and Rob Wagemaker laid the foundation for what would become a thriving European retail chain in just a few decades (Action, 2025).
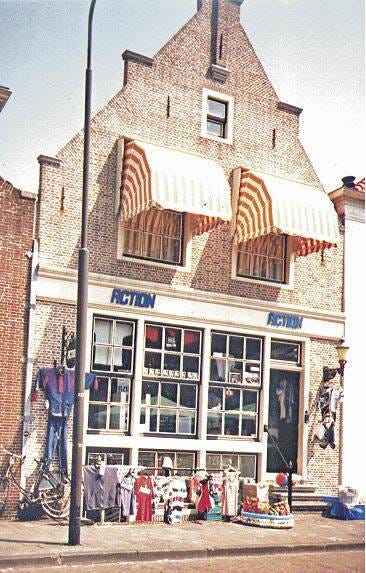
In July 1993, the first Action store opened in Enkhuizen. This venture was spearheaded by Gerard Deen, an antiques dealer, and Rob Wagemaker, who had experience in the supermarket industry procuring non-food products. As a young man in his twenties, Gerard Deen ran an antiques shop but struggled to source compelling inventory (MT/Sprout, 2014). With the assistance of Rob Wagemaker, who brought his expertise as a buyer, they joined forces and began sourcing (surplus) stock at low prices.
This first store quickly proved to be a resounding success. Residents of Enkhuizen visited the shop with great curiosity, eager to discover the latest items the duo had acquired. Fueled by their entrepreneurial spirit, the store was continually restocked with new products, attracting local residents and those from surrounding areas to frequently check for new arrivals. The allure was heightened by the fact that once an item sold out, it was often gone for good.
This success prompted the duo—soon joined by Boris Deen, Gerard’s brother—to expand by opening additional stores across the province of North Holland. The concept resonated similarly in the towns and cities where new stores were established, leading to rapid growth. Within a decade, approximately 100 stores were opened.
Under the leadership of Rob Wagemaker, Gerard Deen, and Boris Deen, Action grew from a single store in 1993 to 100 stores by 2003. That same year, a distribution center was established in Zwaagdijk, where Action’s headquarters remain to this day.
In 2005, Action expanded internationally, opening its first store in Belgium. By the end of that year, the company operated 127 stores. Between 2005 and 2011, the number of stores more than doubled to 269, achieving a CAGR of 13.3%. On July 30, 2011, it was announced that 3i Group, together with the capital from one of its funds—which were still part of 3i’s business model at the time—acquired a majority stake in Action (3i Group, 2011).
In the joint press release issued by Action and 3i Group at the time, Action’s founders commented on the acquisition by 3i Group:
Action has significant growth opportunities in the Netherlands and abroad. We know the consumer demand is there. To seize these opportunities we now need to accelerate growth and 3i will help us in this respect. That is good news for our customers and our staff. It means more consumers will soon be able to experience what Action has to offer and that shopping can be more than just fun—it can also be surprising and cheap. At Action you can always find cool, new items that are excellent value too. That is and remains our goal. — Founders of Action (3i Group, 2011)
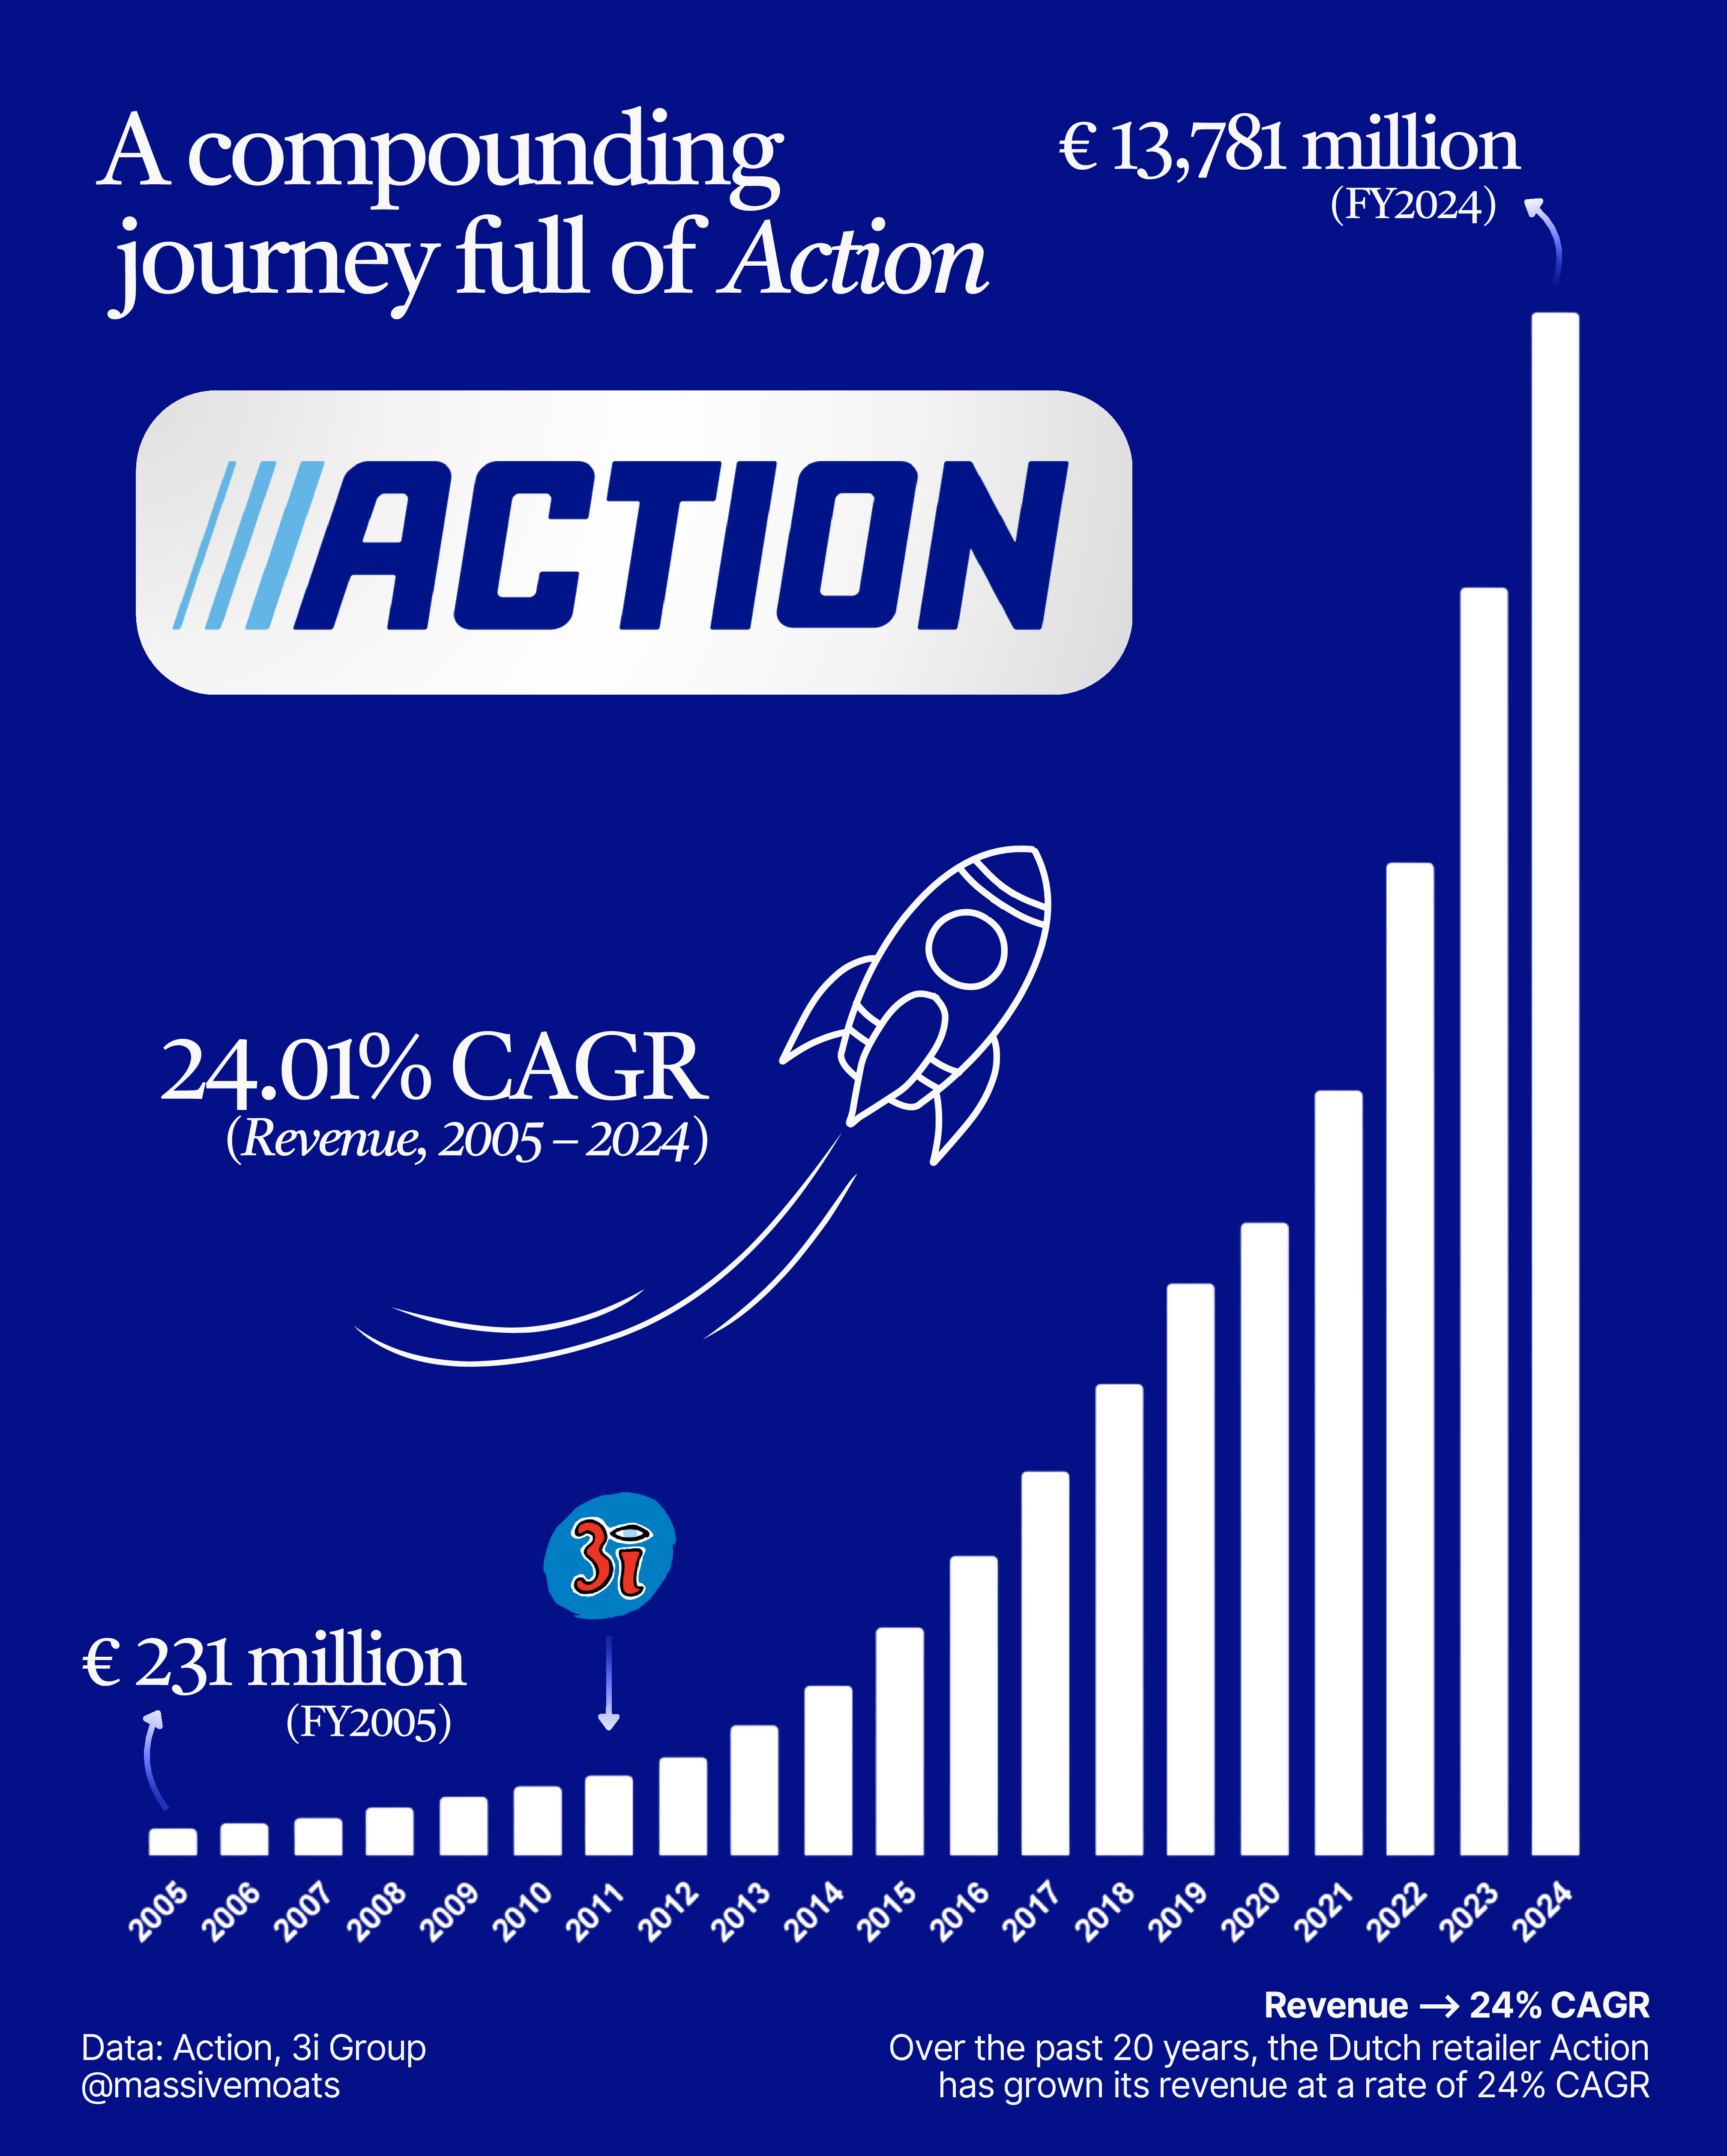
Since the 2011 buyout by 3i Group, the number of Action stores has grown by approximately 2,600 to 2,918 as of December 31, 2024, representing a growth of 20.1% CAGR over this period. This underscores 3i Group’s pivotal role in accelerating Action’s expansion.
The results have been remarkable. While 3i Group and its fund investors reportedly paid around €500 million for Action in 2011, the company is now valued at £31 billion (€36.5 billion) by 3i Group, and even more by investors as the NAV of 3i Group trades at a premium. Furthermore, Action’s owners have received substantial dividend payments in recent years. 3i Group has utilized these dividends, among other resources, to increase its stake in Action by acquiring shares from other existing shareholders and former fund investors. Action is poised to be recorded as one of the most successful private equity transactions in European history.
4.2 | Business Model
Action’s business model is straightforward: consistently procure non-food and food products—with a smaller portion of the assortment comprising pet food, snacks, and soft drinks—at competitive prices and distribute them across its stores. In essence, the strategy revolves around sharp procurement, cost-efficient distribution, and effective sales.
The foundations of this approach have remained largely unchanged since Action’s early years. The company continues to negotiate astutely with suppliers to secure the best possible prices, ensuring affordability for its customers. This responsibility is deeply ingrained in Action’s workforce, who are committed to delivering the lowest prices while sustaining the significant consumer surplus that defines Action’s value proposition. When combined with an element of surprise—where customers are delighted by new product offerings during each store visit—this creates a retail concept that is exceptionally robust.
The element of surprise, paired with competitive pricing, is fundamental to Action’s enduring success. Retailing, in itself, is not a complex science, with many concepts that come, but also often go.
While Dutch concepts like Big Bazar and Blokker succumbed to bankruptcy, Action has thrived in the physical retail landscape. The majority of the product ranges at retailers like Blokker and Big Bazar were predictable: consumers knew what to expect and typically visited these stores with 1) a specific purpose in mind, and 2) purchased only what they needed. In contrast, Action’s customers frequently leave the store with more items than they initially planned to buy, driven by the appeal of its dynamic assortment and value-driven pricing.
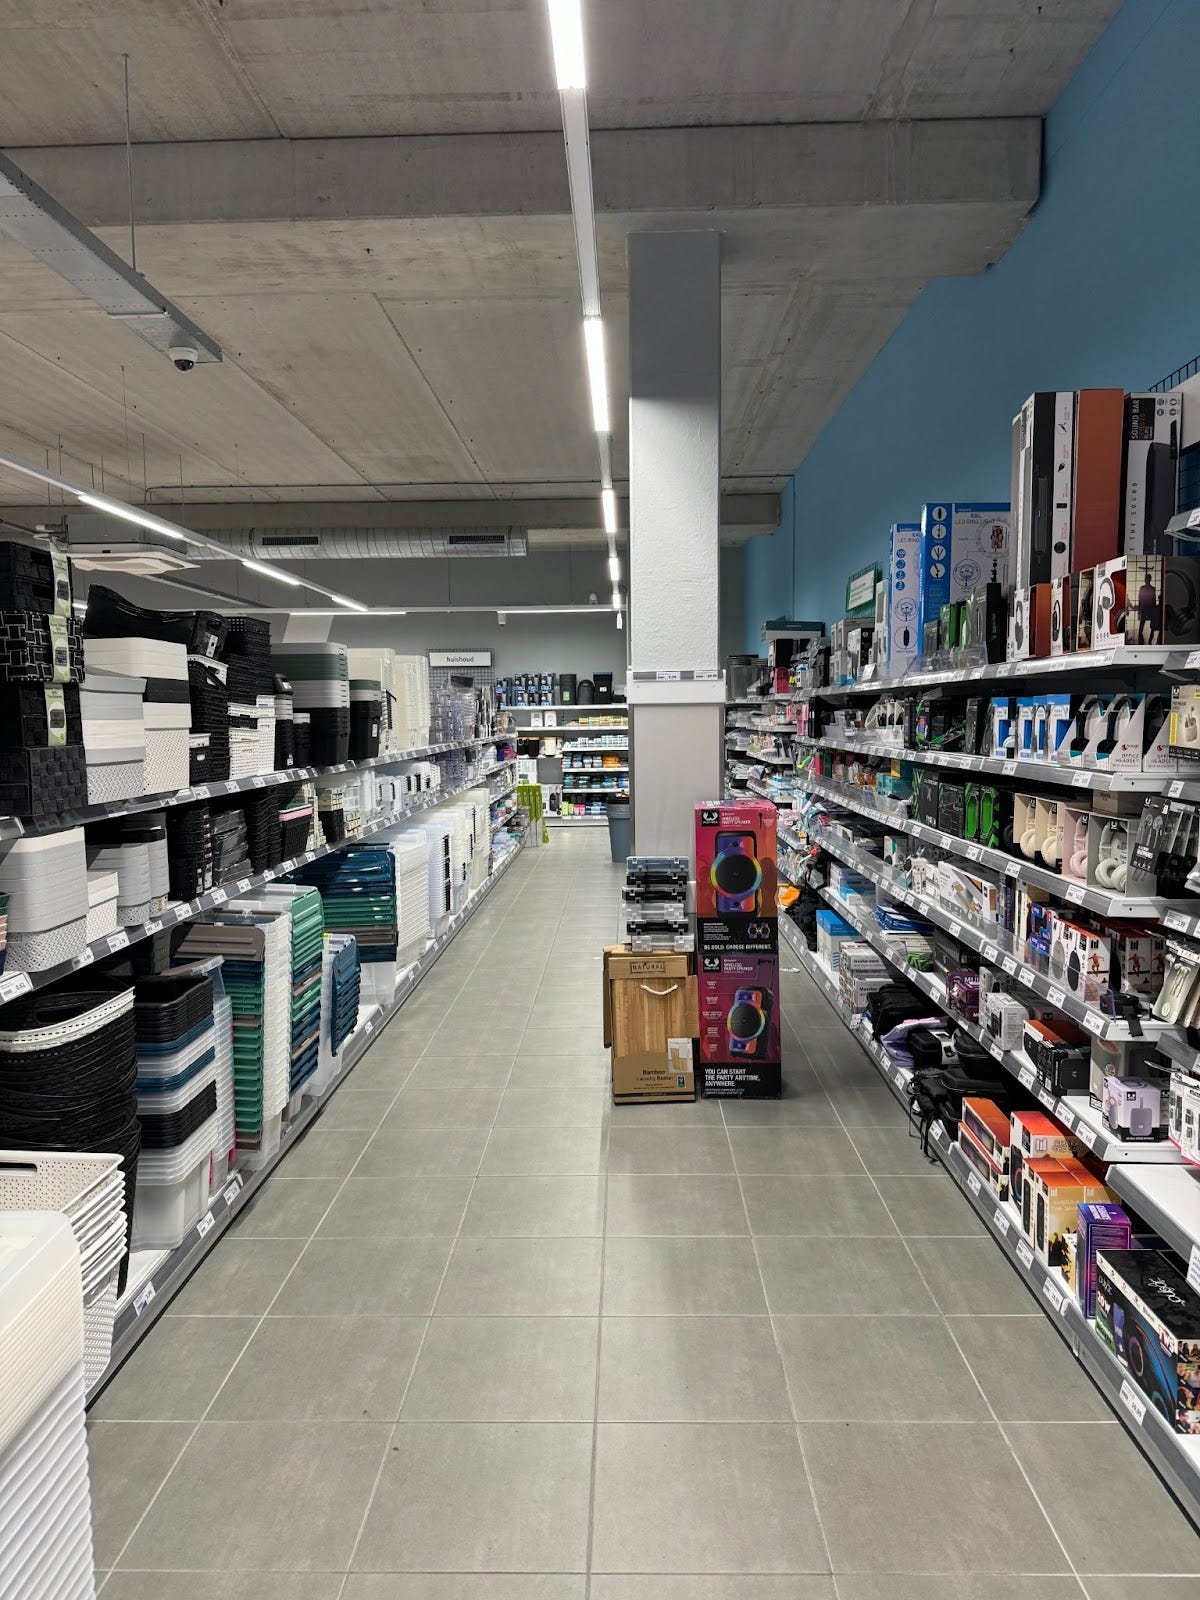
4.2.1 | Stores
Action generates its revenue through its network of over 3,000 stores (as of June 2025) and an online webshop. As of June 8, 2025, Action’s Dutch-language webshop listed 215 products, with prices ranging from €9.95 to €699. No data is available on the sales contribution of the webshop, but it is likely marginal, as I estimate that Action’s primary revenue is derived from its physical stores.
To maintain operational excellence, Action focuses on ensuring that existing stores operate efficiently and effectively. This includes modernizing its current store portfolio while actively seeking new, strategically advantageous locations in towns and cities. An example of this strategy is the relocation of the store in Purmerend (The Netherlands) detailed below.
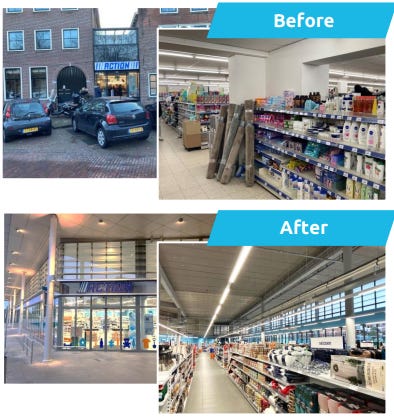
As part of my deep dive analysis, I visited several Action stores in the Netherlands, including both modernized and non-modernized locations. The differences between these stores were immediately evident to me as an observer. However, customers—especially those who predominantly shop at just one location—may not perceive these distinctions as clearly.
At Action, customers seek new, surprising products at the lowest possible prices. The store environment plays a critical role in reinforcing this low-price perception. Modernized stores, with their improved lighting, clean shelving, and optimized aisle widths, create a sleek and inviting atmosphere without compromising the budget-friendly shopping experience. In my view, these enhancements encourage customers to make additional purchases, thereby reinforcing Action’s value proposition.
During my store visits, I evaluated several factors. I selected a range of branded products and compared their prices with those at nearby competitors, such as supermarkets and drugstores, with findings discussed below. Additionally, I observed customer shopping behaviors, employee workflows, interactions among staff, and their engagement with customers. (For context, I have prior experience working in various roles at two supermarkets and a wholesaler, including shelf stocking, sales processing, order picking, and team leadership.)
In fact, Action’s store operations mirror those of a supermarket: customers deplete inventory throughout the day, occasionally inquiring about product locations or restocking timelines, and complete their purchases at the checkout. By evening, a restocking team replenishes shelves with products delivered from the distribution center, ensuring readiness for the next day.
The average Action store has a sales area of c.900 square meters. Store locations are strategically selected within areas having a catchment exceeding 40,000 (3i Group, 2025).
4.2.2 | Assortment
Action offers products across 14 categories (see image above). The company maintains approximately 6,000 individual Stock Keeping Units (SKUs), each representing an unique product with its own barcode. Notably, only one-third of Action’s SKUs form a fixed part of its product assortment.
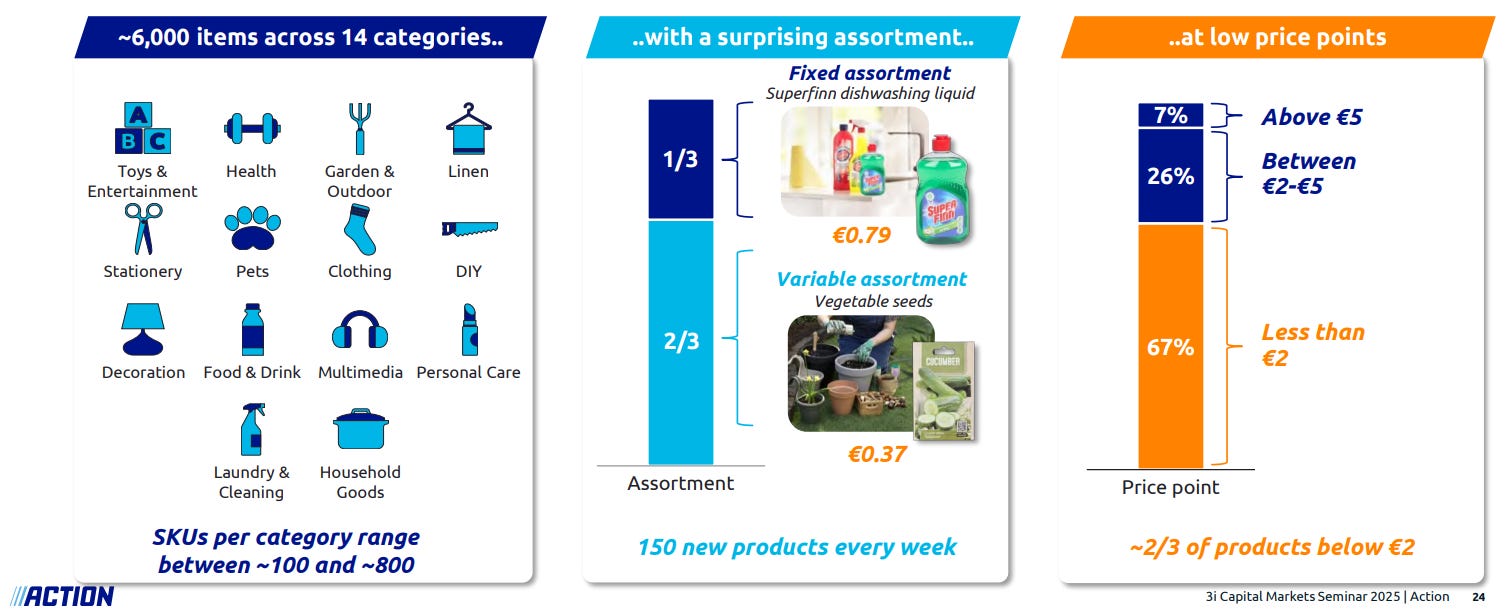
Two-thirds of Action’s product assortment is variable and subject to regular changes. Each Action store receives approximately 150 new products weekly, including seasonal and themed items for spring, summer, Halloween, and Christmas, as well as one-off products that the company can procure at highly competitive prices.
In addition to the 14 product categories mentioned previously, Action’s assortment can be segmented into 3 groups: branded products (A-brands), white labels, and private labels.
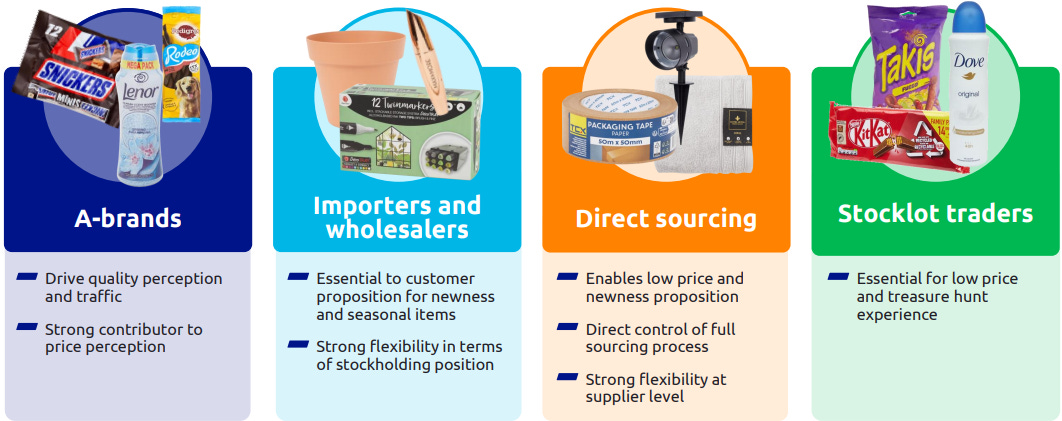
A-brands
The inclusion of A-brands enhances the perception of a high-quality assortment. By offering well-known A-brand products, Action enables consumers to directly compare its pricing against competitors, reinforcing its commitment to low prices. Furthermore, A-brands purchased in bulk—mostly custom made packaging and stocklot traders—allow Action to offer these products at exceptionally competitive prices, creating a treasure hunt experience that encourages customers to hunt for bargains.
Action sells well-known A-brands familiar to consumers in Europe, such as Lotus biscuits, Whiskas cat food, Mars and M&M’s chocolates, Listerine mouthwash, and local A-brands such as Robijn laundry detergent and Dreft dishwashing liquid.
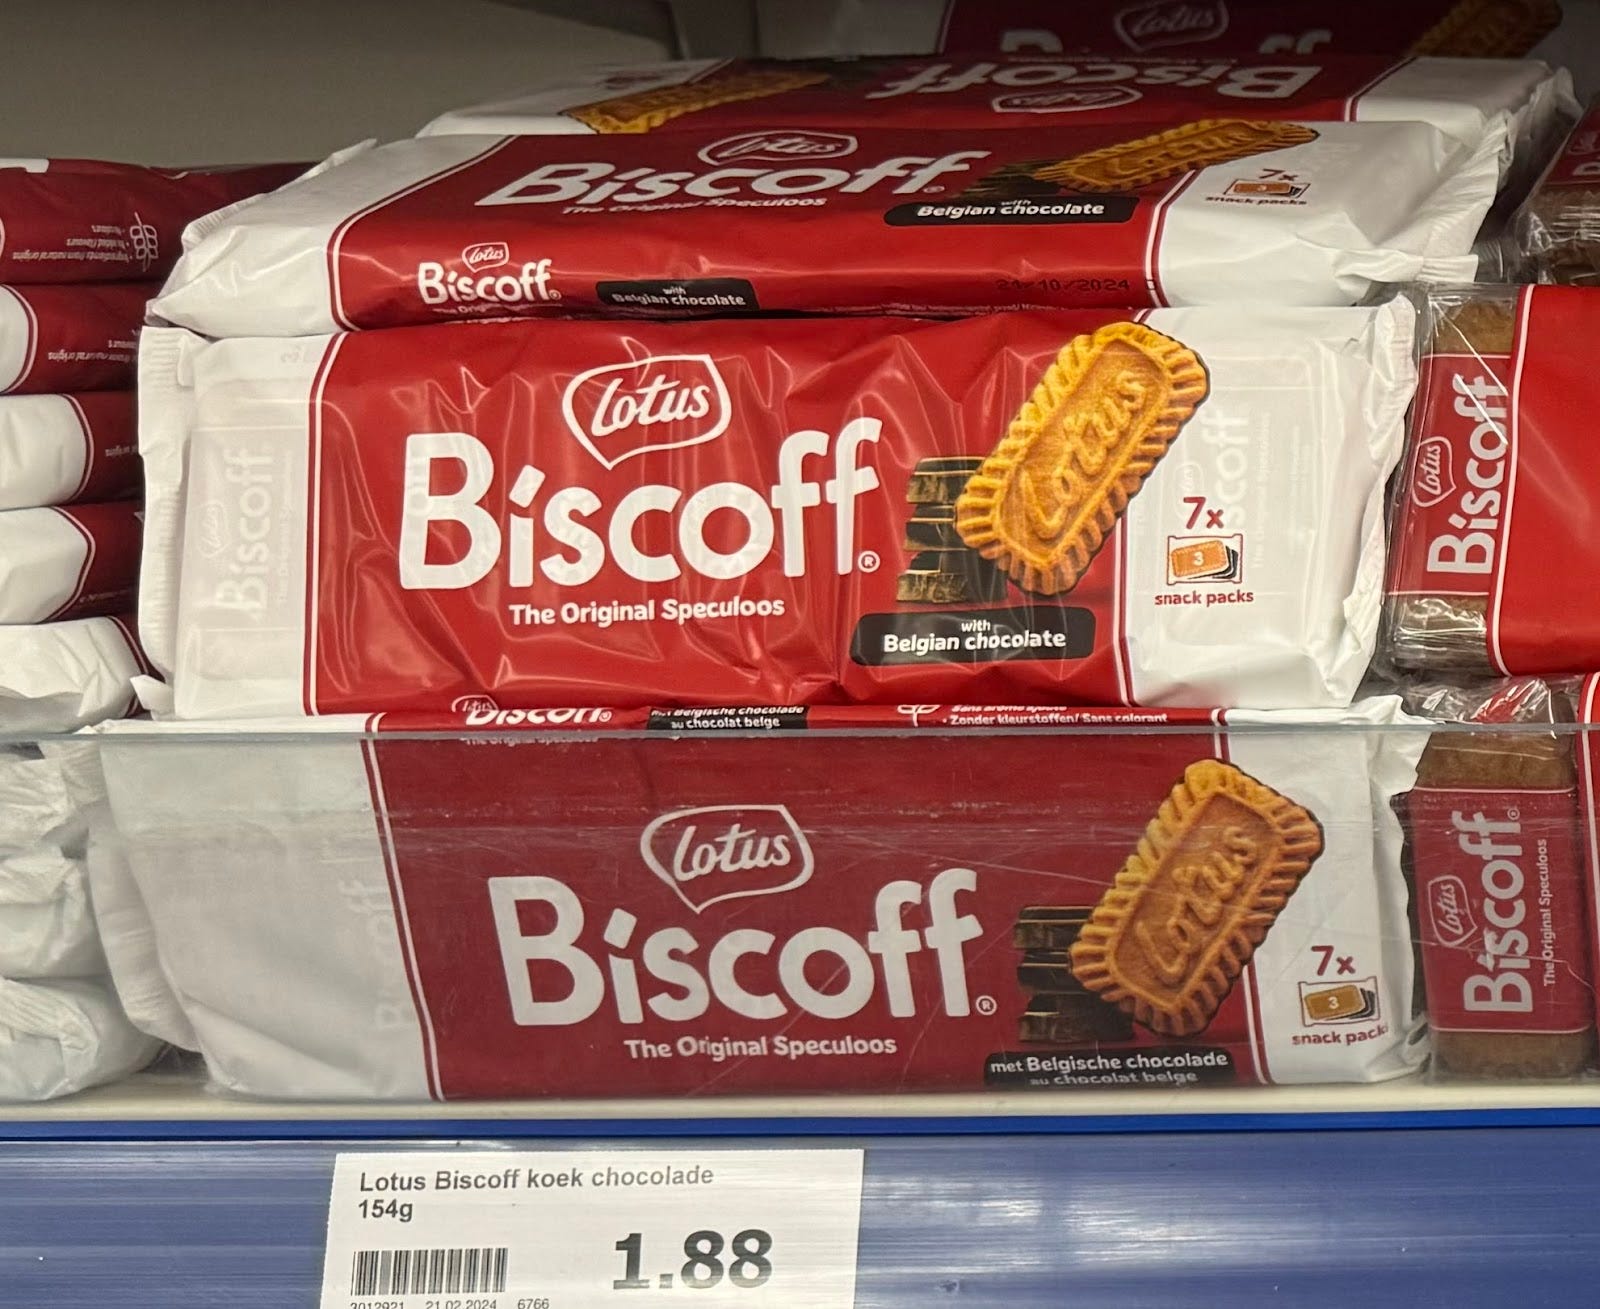
Based on my price comparisons of A-brand products, Action consistently offers lower prices than competitors. For instance, a pack of Lotus biscuits is priced 16.5% higher at the Dutch supermarket Albert Heijn than at Action. Similarly, a 135-gram bag of M&M’s is 36.5% more expensive at supermarkets (Albert Heijn, €2.99; Plus, €2.99) compared to Action (€2.19).
These comparisons involve products that are part of Albert Heijn’s regular assortment and may also be consistently available at Action (at least available for longer periods than seasonal items).
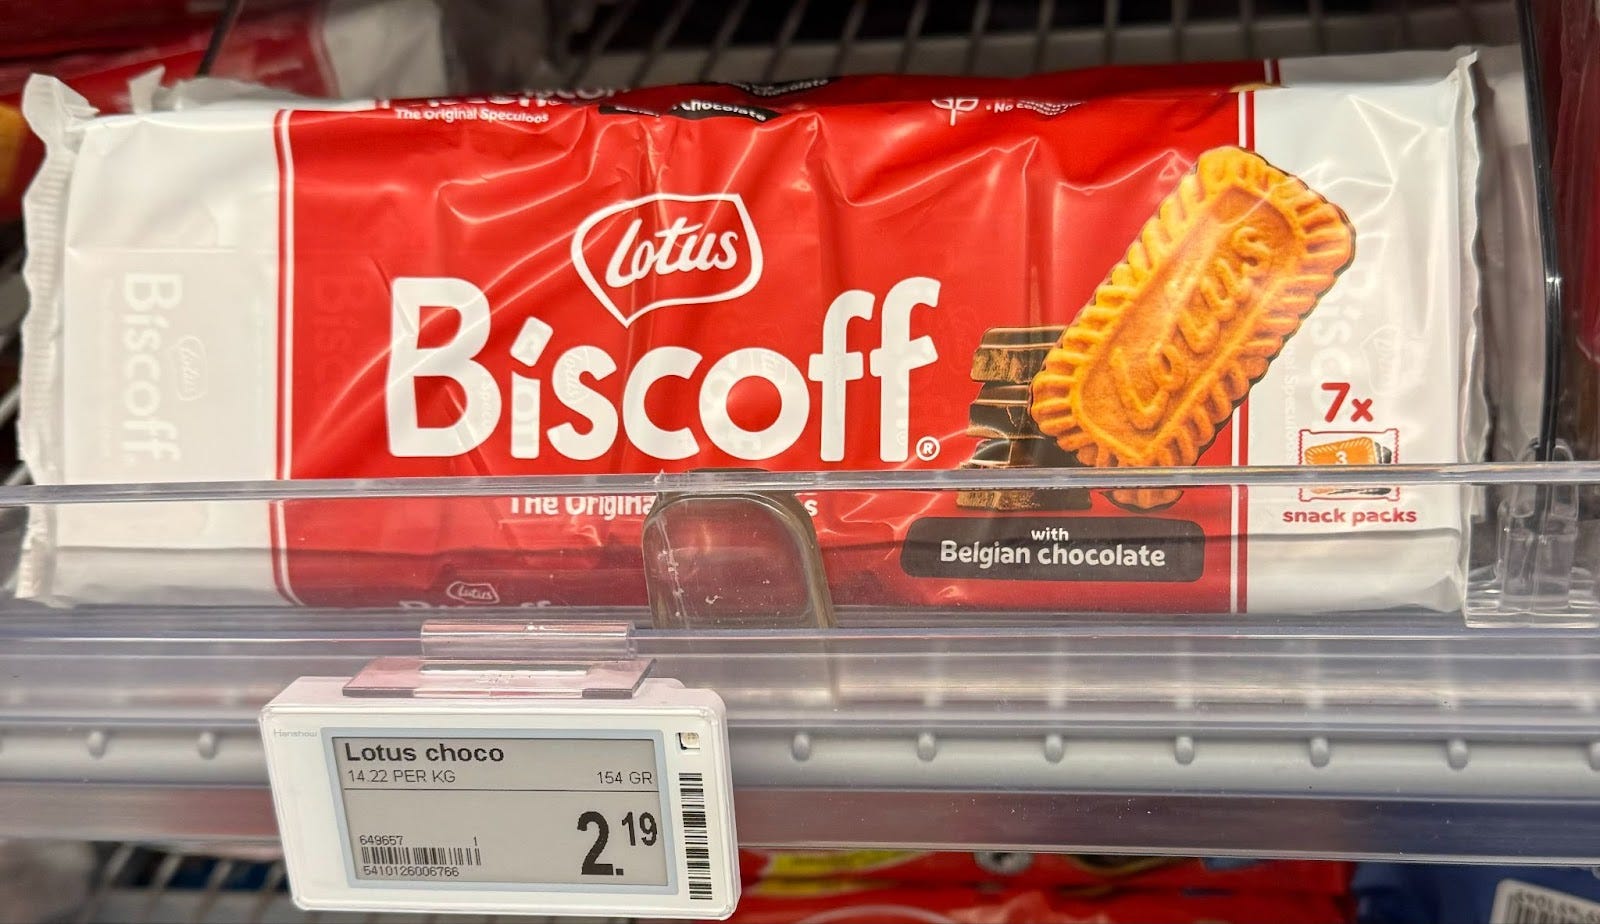
Additionally, Action acquires batches of A-brand products that are discontinued from the regular assortments of supermarkets and drugstores, such as limited-edition Robijn laundry detergent.
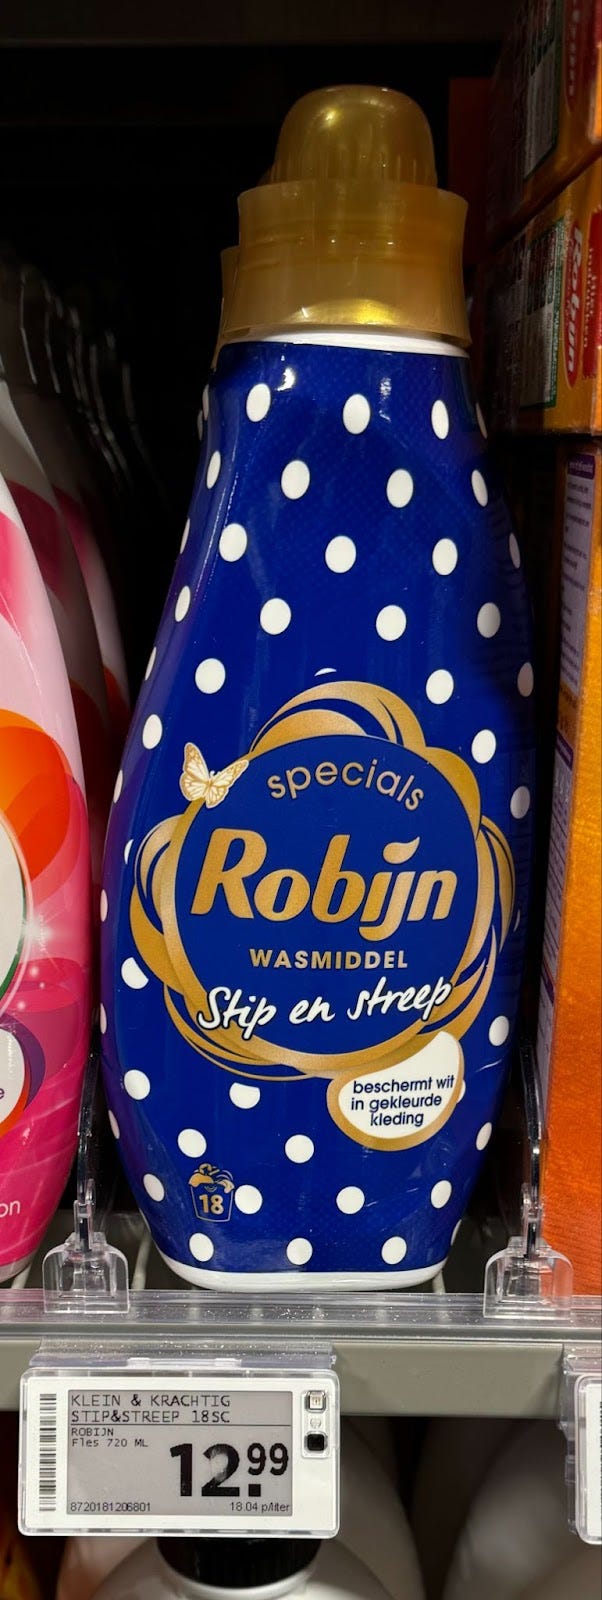
The Robijn Special as displayed above is explicitly a limited-edition product available only for a limited period.
When Unilever—Robijn being one of its brands—introduces a new limited-edition variant of its Robijn laundry detergent, it discontinues supply of the previous special to its customers, such as supermarkets, to make room for the new variant. If Unilever has residual stock in its warehouses, a retailer like Action provides a solution. Action can purchase these batches at highly competitive prices due to its substantial distribution capacity, enabling it to acquire large volumes of surplus inventory in a single transaction. This frees up warehouse space for Unilever while allowing Action to offer these products to customers at significantly reduced prices. For instance, in the case of the aforementioned Robijn laundry detergent, Action’s price is 70% lower than that of the Plus supermarket in the same town, offering a high consumer surplus for its customers.
White Labels
White label products are manufactured by third-party producers and branded with a label chosen by Action. These products, with different labels, may also appear at other retailers. The contents remain identical, with only the labeling differing.
White label products enhance Action’s assortment, particularly for seasonal items, by providing flexibility in procurement and inventory management. The ability to scale purchasing up or down allows Action to maintain optimal stock levels, which in turn reduces costs.
Private Labels
Action’s assortment also includes private label products, which are manufactured exclusively for Action by external producers. This allows Action to exercise direct control over the entire procurement process. Through its private labels, Action can offer a highly competitively priced product range. As of 2024, Action’s 73 private labels have frequently received accolades across various product categories (Action, 2025). For instance, the towels sold under the Hotel Royal brand have been recognized for their quality. The Hotel Royal private label is positioned with the following motto [translated]:
Treat yourself to the luxury and comfort of a hotel at home. With the elegant towels and duvet covers from Hotel Royal, you can experience that hotel feeling at home for a fraction of the price. — Action (2024)
Other award-winning private label products include makeup under the Max & More brand, cleaning products under Superfinn, tissues under Pure Soft, and paint under the Spectrum label (Action, 2025).
Having established a deeper understanding of Action’s product assortment, it is now time to examine the second pillar of Action’s business model further: pricing.
4.2.3 | Pricing
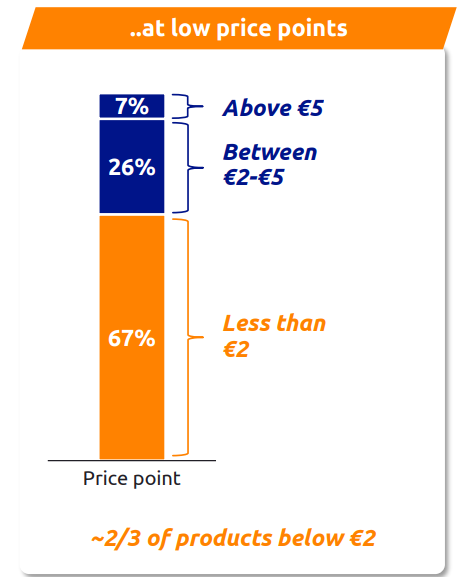
67% of Action’s assortment of around 6,000 products is priced below €2, while only 7% of products carry a price tag above €5 (Action, 2025).
This pricing strategy establishes a foundation for the bargain hunting experience, with Action’s price points significantly shaping consumer perception of value.
As observed earlier with specific product’s price comparisons, Action’s comparable products are priced lower than those of competing retailers. This is further illustrated in the figure below, compiled based on price comparisons of 1,500–2,000 similar products offered by Action’s competitors, with distinctions made by country.
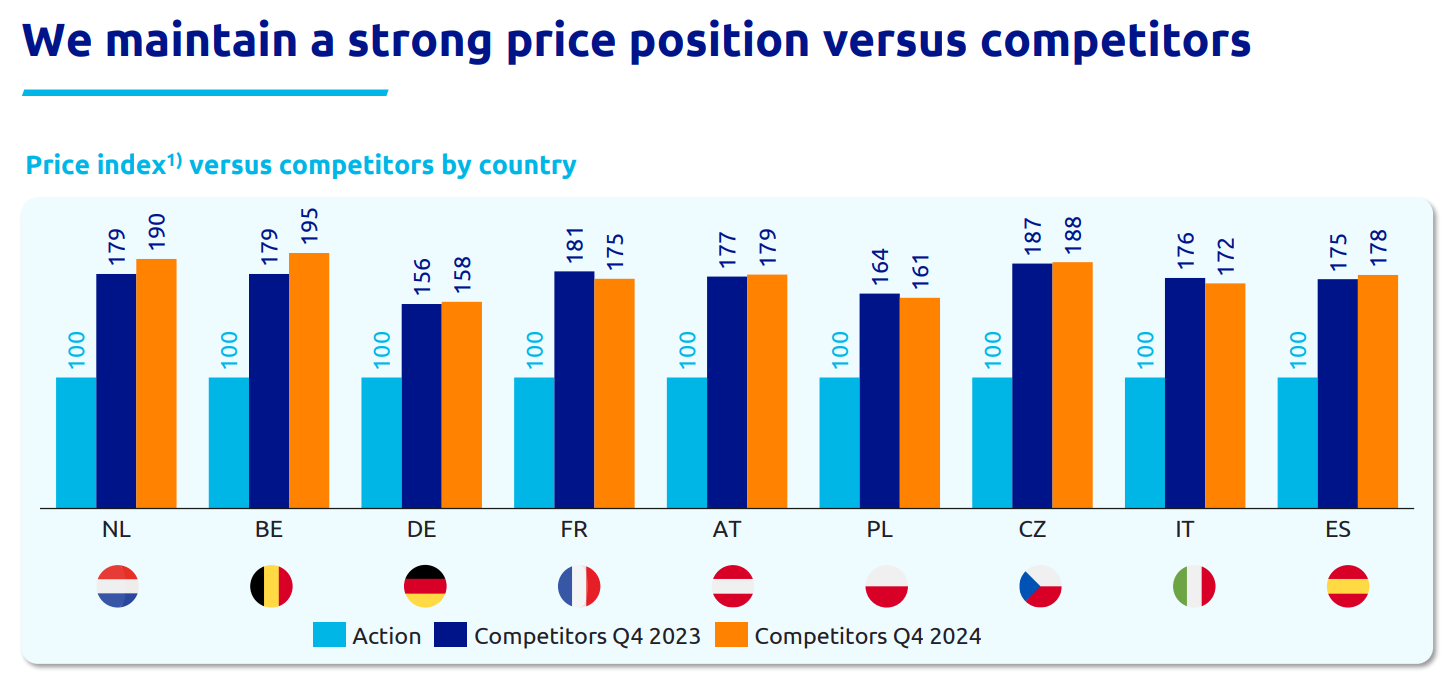
In the Netherlands, competitors’ product prices are 90% higher than those at Dutch Action stores. This price gap has widened by 11 percentage points since Q4 2023 and by 22 percentage points since Q4 2022.
Across Europe, the price differential ranges from 58% to 95%, with Germany exhibiting the smallest gap at 58%. Unlike in the Netherlands, where supermarkets and drugstores frequently offer promotions, such discounts are less common in Germany.
On November 14, 2024, the Dutch financial newspaper ‘Het Financieele Dagblad’ published an article citing research by Circana, which revealed that nearly 60% of Dutch drugstore revenue now stems from promotional offers. The article also quoted Gerard Spierenburg from the Dutch Consumentenbond, who noted that personal care products in Germany are, on average, 50% cheaper. It further stated that the base price of products in the Netherlands, excluding promotions, is approximately 25% lower. Additionally, Laurens Sloot, Professor of Retail Entrepreneurship at the University of Groningen, highlighted that around 25% of an average Dutch supermarket’s revenue currently comes from promotions, up from 14% twenty years ago.
Action, by contrast, does not rely on promotional discounts to drive sales; instead, it maintains consistently low fixed prices. However, the company does introduce weekly campaigns to highlight new products, often including seasonal, themed, or bulk items, within its assortment.
Unlike retail concepts such as the Dutch Hema, Eurowinkels, certain drugstores, or discount stores, which predominantly use uniform pricing (e.g., €2, €4, €0.99, or €1.99), Action prices its assortment based on the cost of procurement plus a margin. This results in product prices such as €1.23, €1.52, or €1.11, which, in the interest of the customer, are not rounded up to the nearest €1.49 or €1.99. That said, Action’s assortment also includes many products priced at figures like x.x9 or x.95.
In 2024, Action reduced the prices of 2,000 products (3i Group, 2025), following price cuts on 2,500 products in 2023 (Action, 2024). These initiatives underscore Action’s commitment to prioritizing the customer, a principle embedded in its six core values.
4.3 | Core Values, Customer Satisfaction, and Customer Segments
4.3.1 | Core Values
Action’s core values are built on six key pillars: customer focus, teamwork, simplicity, discipline, cost-consciousness, and respect (Action, 2025).
Customer Focus
The customer comes first in everything we do. We offer a surprising assortment of good quality products at the lowest possible prices. With our customers’ interests in mind, we keep costs as low as possible. The value Customer Focus guides everyone at Action, not just our staff working in the stores.
Teamwork
We believe that teamwork gets the best results. It is important to offer to help each other, because together we can achieve more. As a team, we share ownership, we have common goals, and our deliverables are clear. Successes and disappointments are to be shared, and we address issues within the team immediately – transparently and respectfully.
Simplicity
In a rapidly growing organisation, losing simplicity – one of our original strengths – is a big risk. Many larger organisations become political, complex and bureaucratic and lose their edge. Maintaining simplicity does not mean idealising a lack of structure. Quite the contrary: making and keeping things simple requires structured, controlled ways of working across large parts of our business.
Discipline
Discipline encompasses all of Action’s values. When we are disciplined, we are on time and prepared for meetings, which is respectful to others and also enhances teamwork. Being disciplined and sticking to the rules means we are cost conscious and keep things simple. Most importantly, we are disciplined in always keeping the customers’ interests at the forefront of our minds.
Cost conscious
This is the cornerstone of our business model. Cost consciousness is not about not spending money; it is about spending money efficiently and keeping costs low, all in the interest of our value proposition to customers. We want to use simplicity and scale to save money and offer the lowest prices. This is a key value that guides us in staying humble.
Respect
Respect is what we owe each other as human beings. This value is important when it comes to customers, colleagues and business partners. Combining sympathy and kindness with direction and clarity to create a sense of belonging and safety. We maintain a culture in which giving and receiving constructive feedback is always considered a sign of respect.
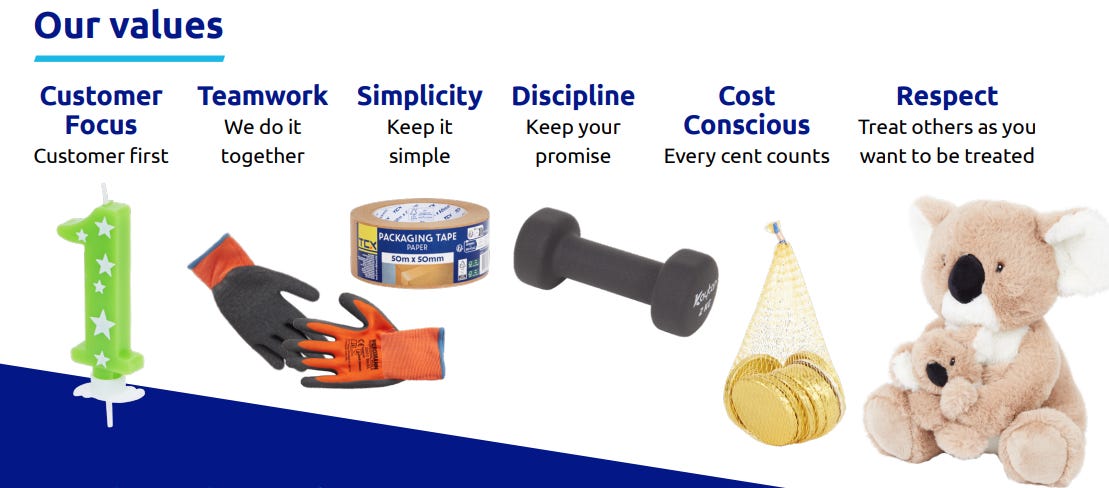
Unsurprisingly, Customer Focus ranks first among Action’s six core values. The other five values—teamwork, simplicity, discipline, cost-consciousness, and respect—also directly benefit the customer. By maintaining a straightforward business model and culture, coupled with a deliberate emphasis on minimizing overhead costs, Action achieves lower operational expenses. This approach inherently creates greater flexibility to offer competitive pricing, enabling Action to surpass more expensive retail chains.
4.3.2 | Customer Satisfaction
Action’s prioritization of the customer is reflected in its strong customer satisfaction metrics. In France, where Action operates over 850 stores, the company was named the favorite brand (Enseigne préférée des Français, 2025) for the third consecutive year in 2025. This accolade places Action ahead of prominent competitors such as Decathlon, IKEA, and McDonald’s.
Action’s rise in this ranking has been notable: it entered the top 10 in 2020 at 9th place, climbed to 7th in 2021, secured third place in 2022, and has consistently held the top position in the years since.
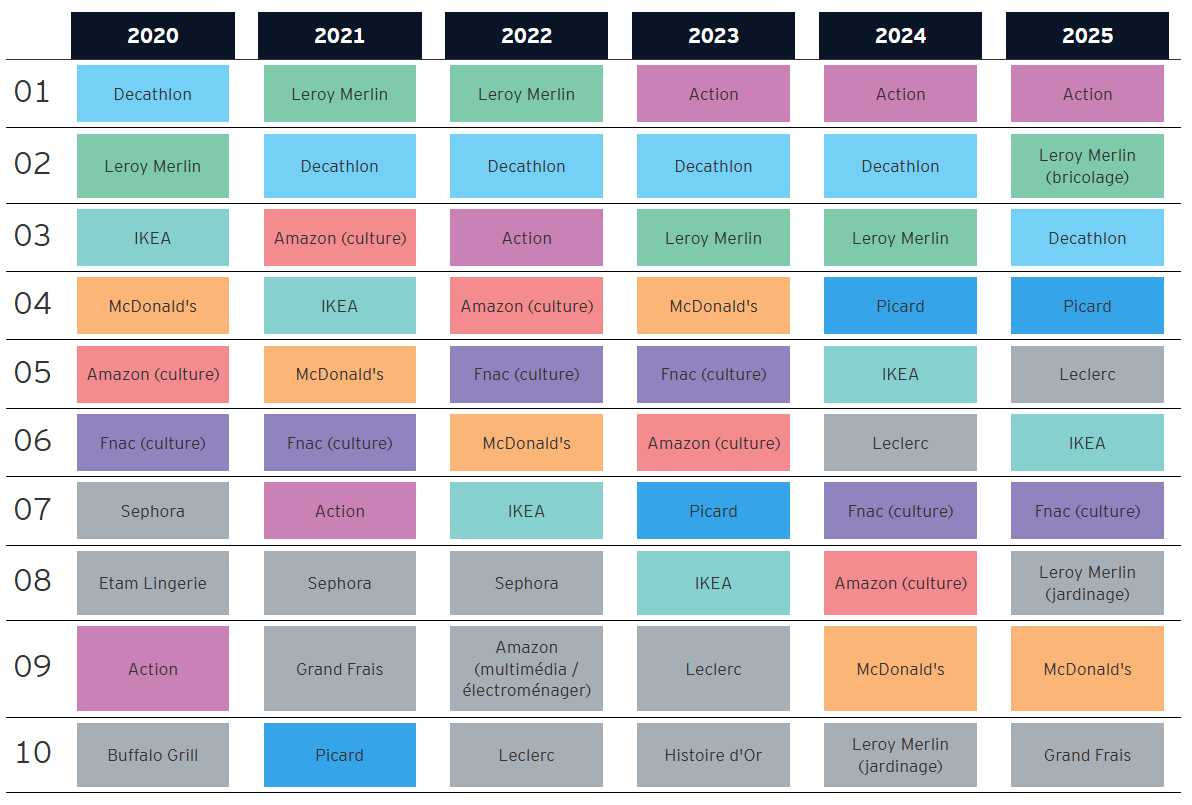
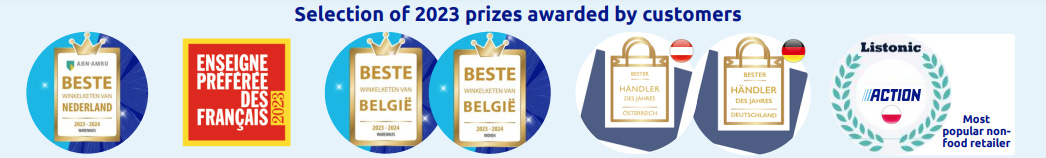
In addition to the Netherlands and France, Action frequently receives accolades in other European countries, including Poland, Germany, Belgium, and Austria (Action, 2024).
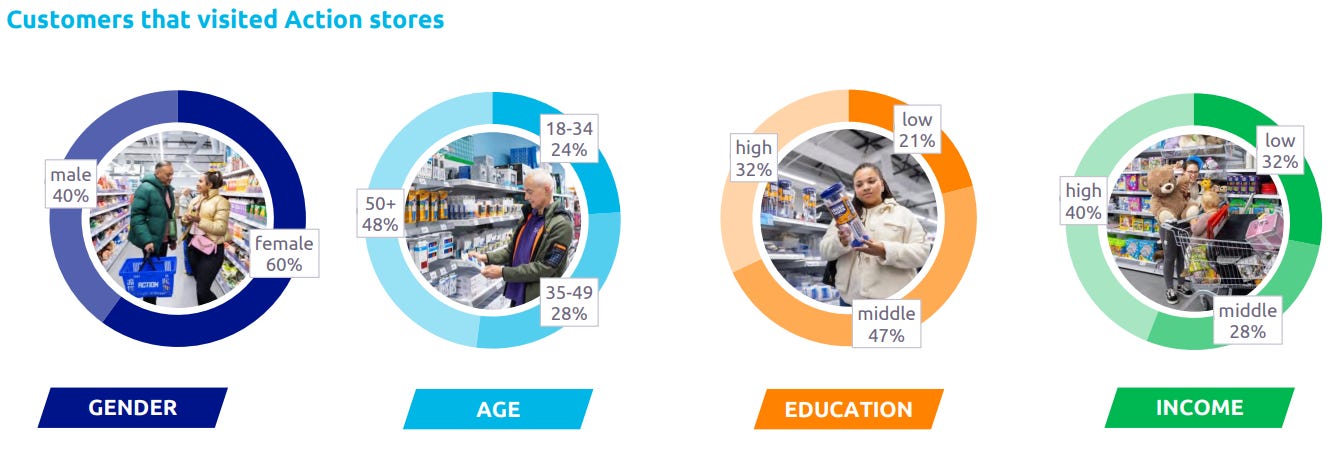
4.3.3 | Customer Segments
So, who shops at Action? A customer survey conducted by Action in 2024, summarized in the table below, highlights the diversity of its customer base. Action appeals to a broad demographic, including men and women, young and old, those with practical or theoretical education, and individuals across income levels. This versatility positions Action as a retailer that caters to all segments of the market (Action, 2024).
The figure below illustrates Action’s brand awareness and penetration rates across the countries in which it operates.
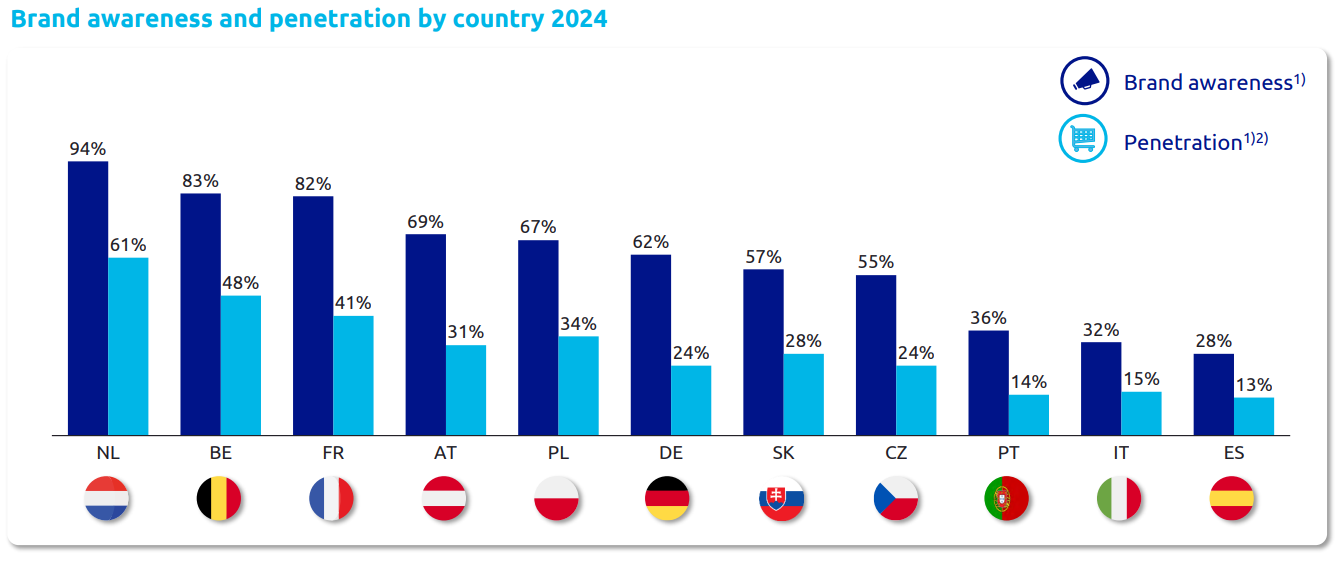
In its home market of the Netherlands, 94% of respondents are familiar with Action, and 61% reported purchasing one or more products in the six months prior to the survey. These metrics are notably lower in other European countries, indicating both challenges and opportunities for further market penetration.
4.4 | European Expansion
Under 3i Group’s ownership, Action has significantly expanded its presence across Europe since 2011. Following the acquisition by 3i Group, the number of Action stores grew from 269 to 2,755 by September 30, 2024.
In 2011, the majority of Action’s stores were located in the Netherlands. However, by early 2025, the Netherlands accounts for only 14% of the company’s total store count, with 418 stores.
3i Group recognized significant growth opportunities and facilitated Action’s further expansion across Europe. The investment firm acted swiftly following its entry, opening Action’s first store in France in 2012. Today, Action operates over 850 France stores, representing 29% of Action’s total store network, making it the company’s largest market in terms of store count.
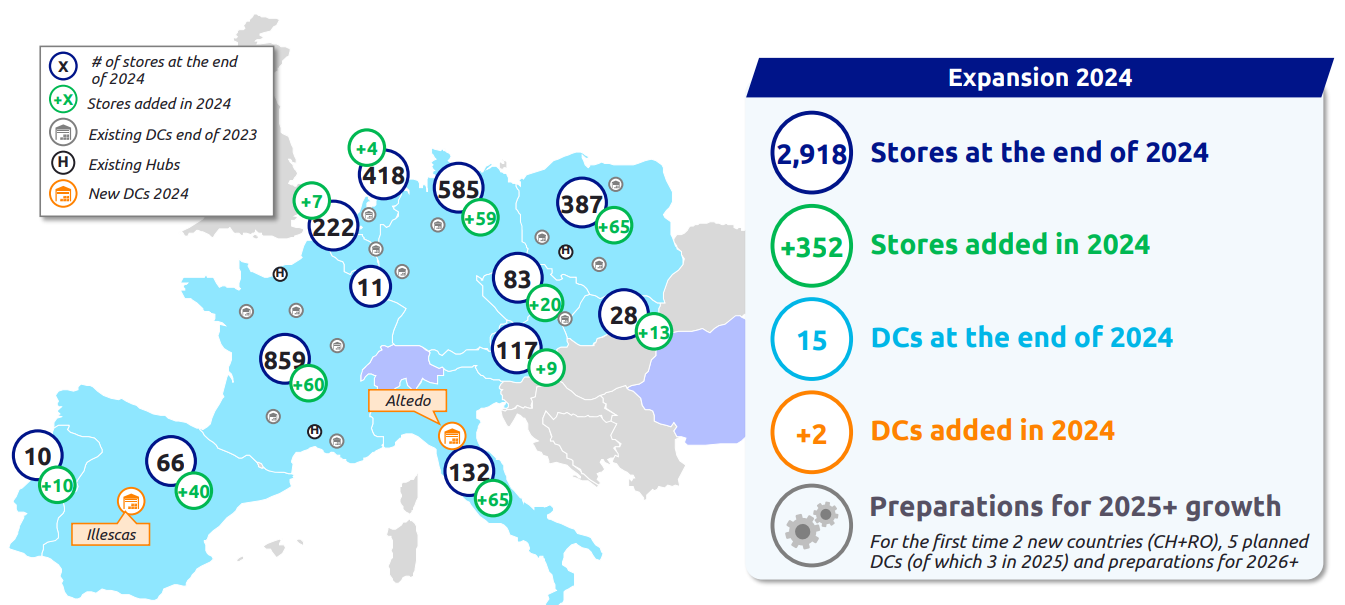
Germany ranks second with 585 stores, accounting for approximately 20% of Action’s total store network. The Netherlands follows in third place, while Poland ranks fourth with 387 stores (13%). Belgium holds the fifth position with 222 stores (8%), and Austria is sixth with 117 stores (4%).
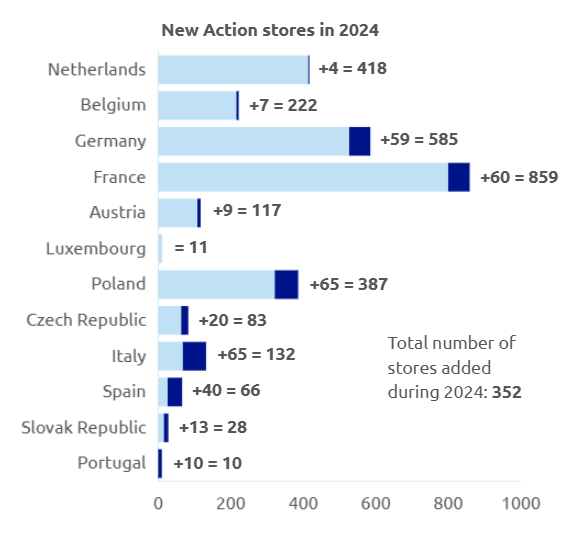
Together, France, Germany, the Netherlands, and Poland constitute the core markets, representing 77% of Action’s total stores at the moment.
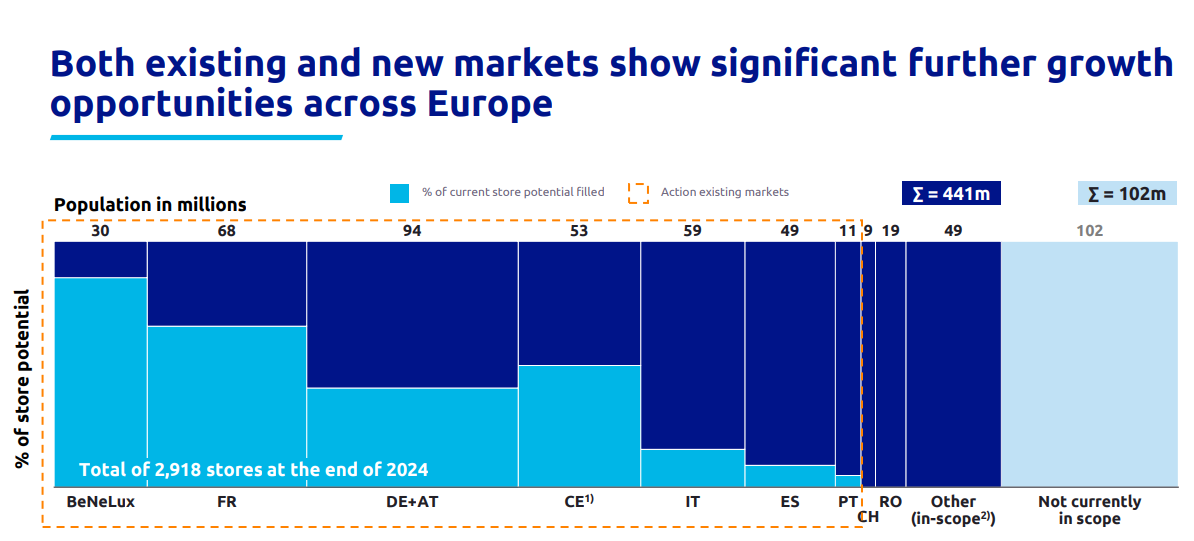
Countries such as Spain, Italy, Slovakia, Portugal offer significant growth potential, according to Action. The figure below ranks Action’s operating countries based on the number of stores per million inhabitants. The Netherlands, Action’s home market, is largely saturated, whereas Spain—with a population of over 48 million, approximately 170% larger than the Netherlands—remains in the early stages of market penetration.
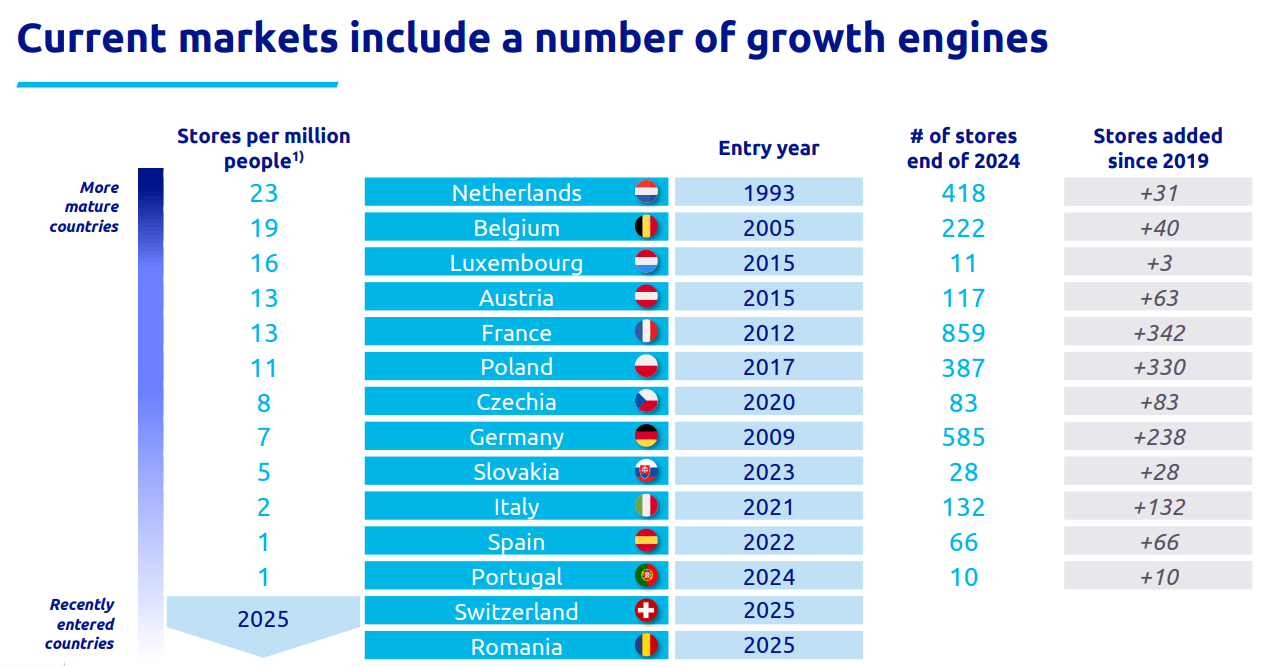
The subsequent figure illustrates the growth potential of Action’s in-scope countries. While the Benelux region (Belgium, the Netherlands, and Luxembourg) shows limited potential for further expansion, countries such as France, Germany, and Central Europe present substantial opportunities for future growth.
In markets where Action has recently entered, such as Italy, Spain, and Portugal, the growth potential exceeds 80%.
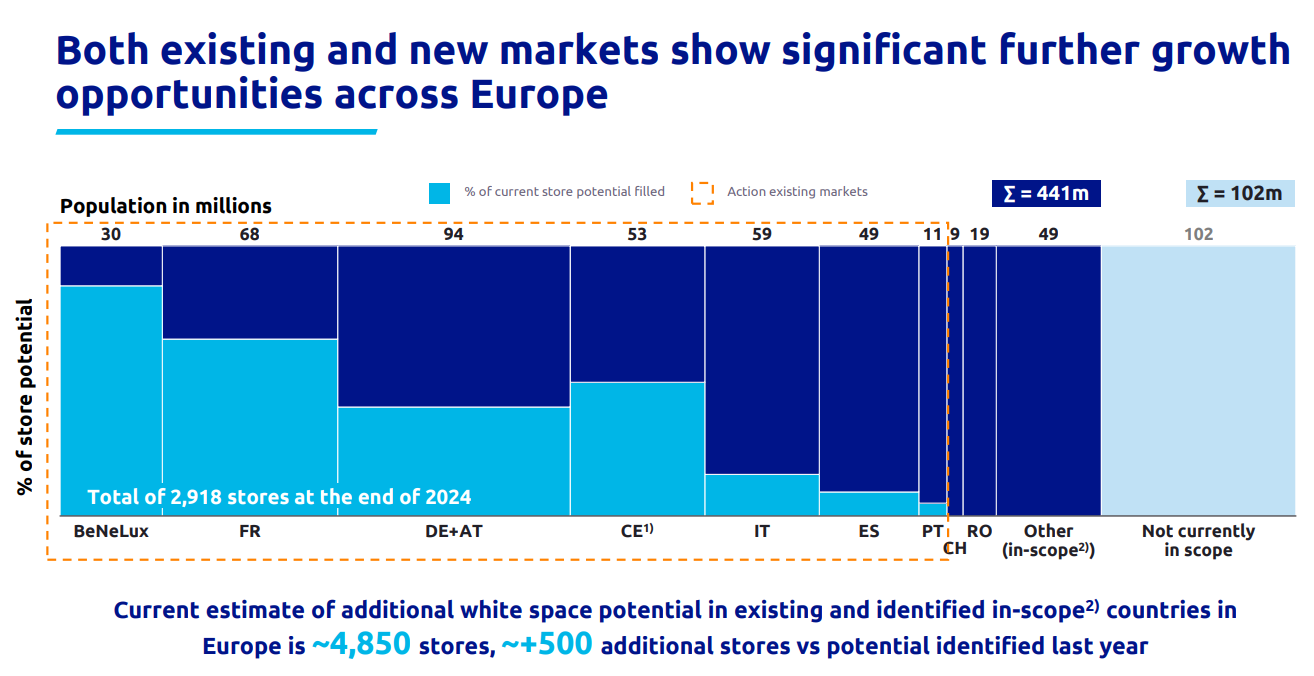
3i Group estimates that Action’s potential for new stores within existing and identified in-scope countries is approximately 4,850. With a current base of around 3,000 stores, this represents a potential to expand Action’s footprint by 160%. This figure excludes additional growth opportunities in countries currently outside the scope of Action.
The potential for Action’s future expansion is explored in greater detail in the chapter addressing valuation.
4.5 | Logistics
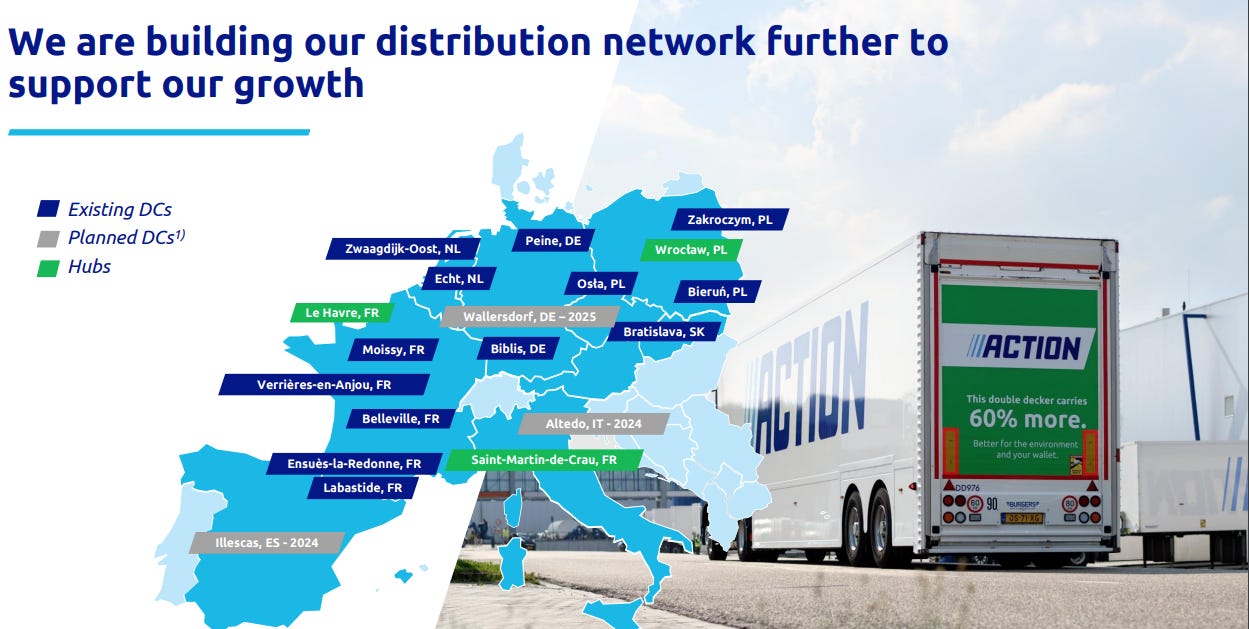
All 3,000 Action stores require consistent restocking, as inventory is critical to generating revenue. An efficient distribution system is therefore paramount for Action. The figure below provides an overview of Action’s logistics chain.
Action’s procurement team sources products at the lowest possible prices while ensuring a good level of quality.
These products are then shipped or transported directly from the manufacturer or supplier warehouses to Action’s distribution centers.
From there, Action distributes the products to its stores.
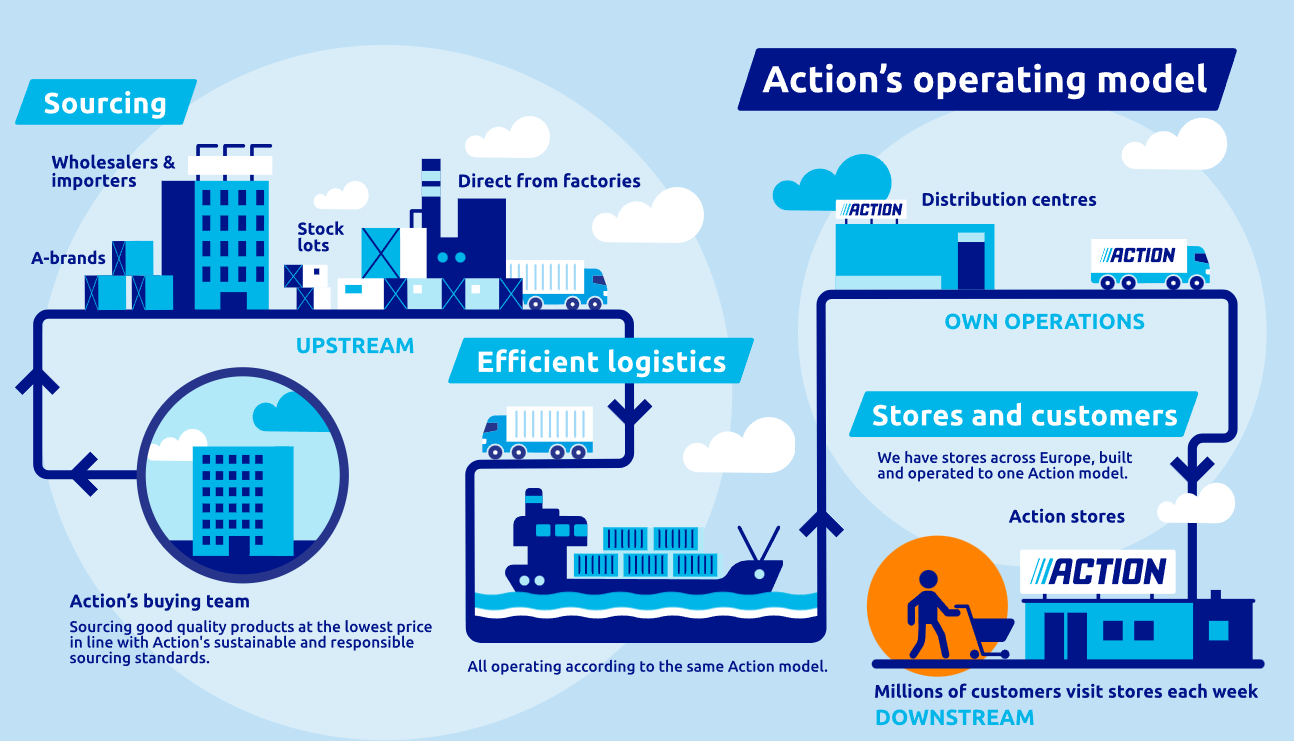
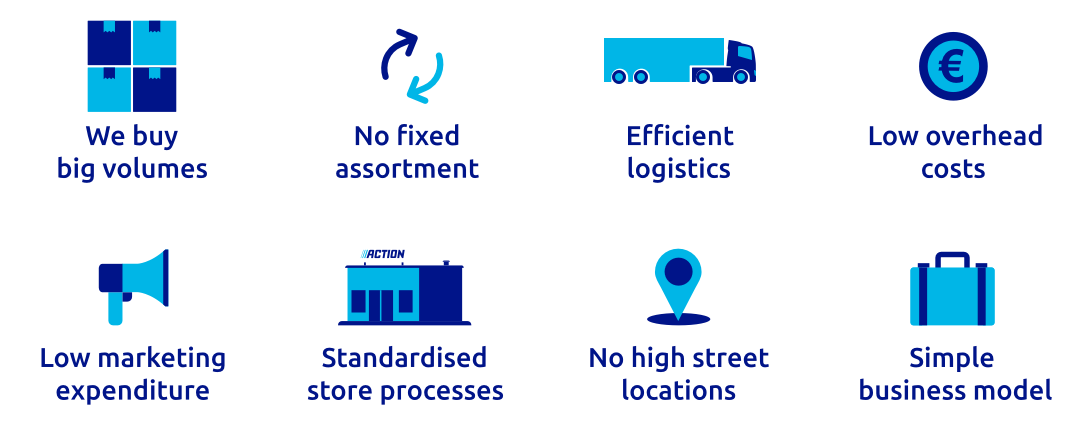
Beyond maintaining an efficient and seamless distribution process—which has not always been flawless in Action’s history, as discussed later—Action’s competitive advantage stems primarily from its ability to procure compelling products at sharp prices, both in terms of cost and assortment variety. This is coupled with cost-efficient distribution and a focus on minimizing overhead expenses. And rather than investing in expensive marketing campaigns or premium store locations, since Action channels these cost savings into price reductions, directly benefiting its loyal customer base.
4.6 | Competitive Analysis
To initiate the competitive analysis, we begin with the domestic market of Action’s home country, The Netherlands. In the Netherlands, no concepts precisely replicate Action’s business model. The closest competitors, or those that historically came nearest to Action’s approach, include retailers such as Kruidvat and Big Bazar.
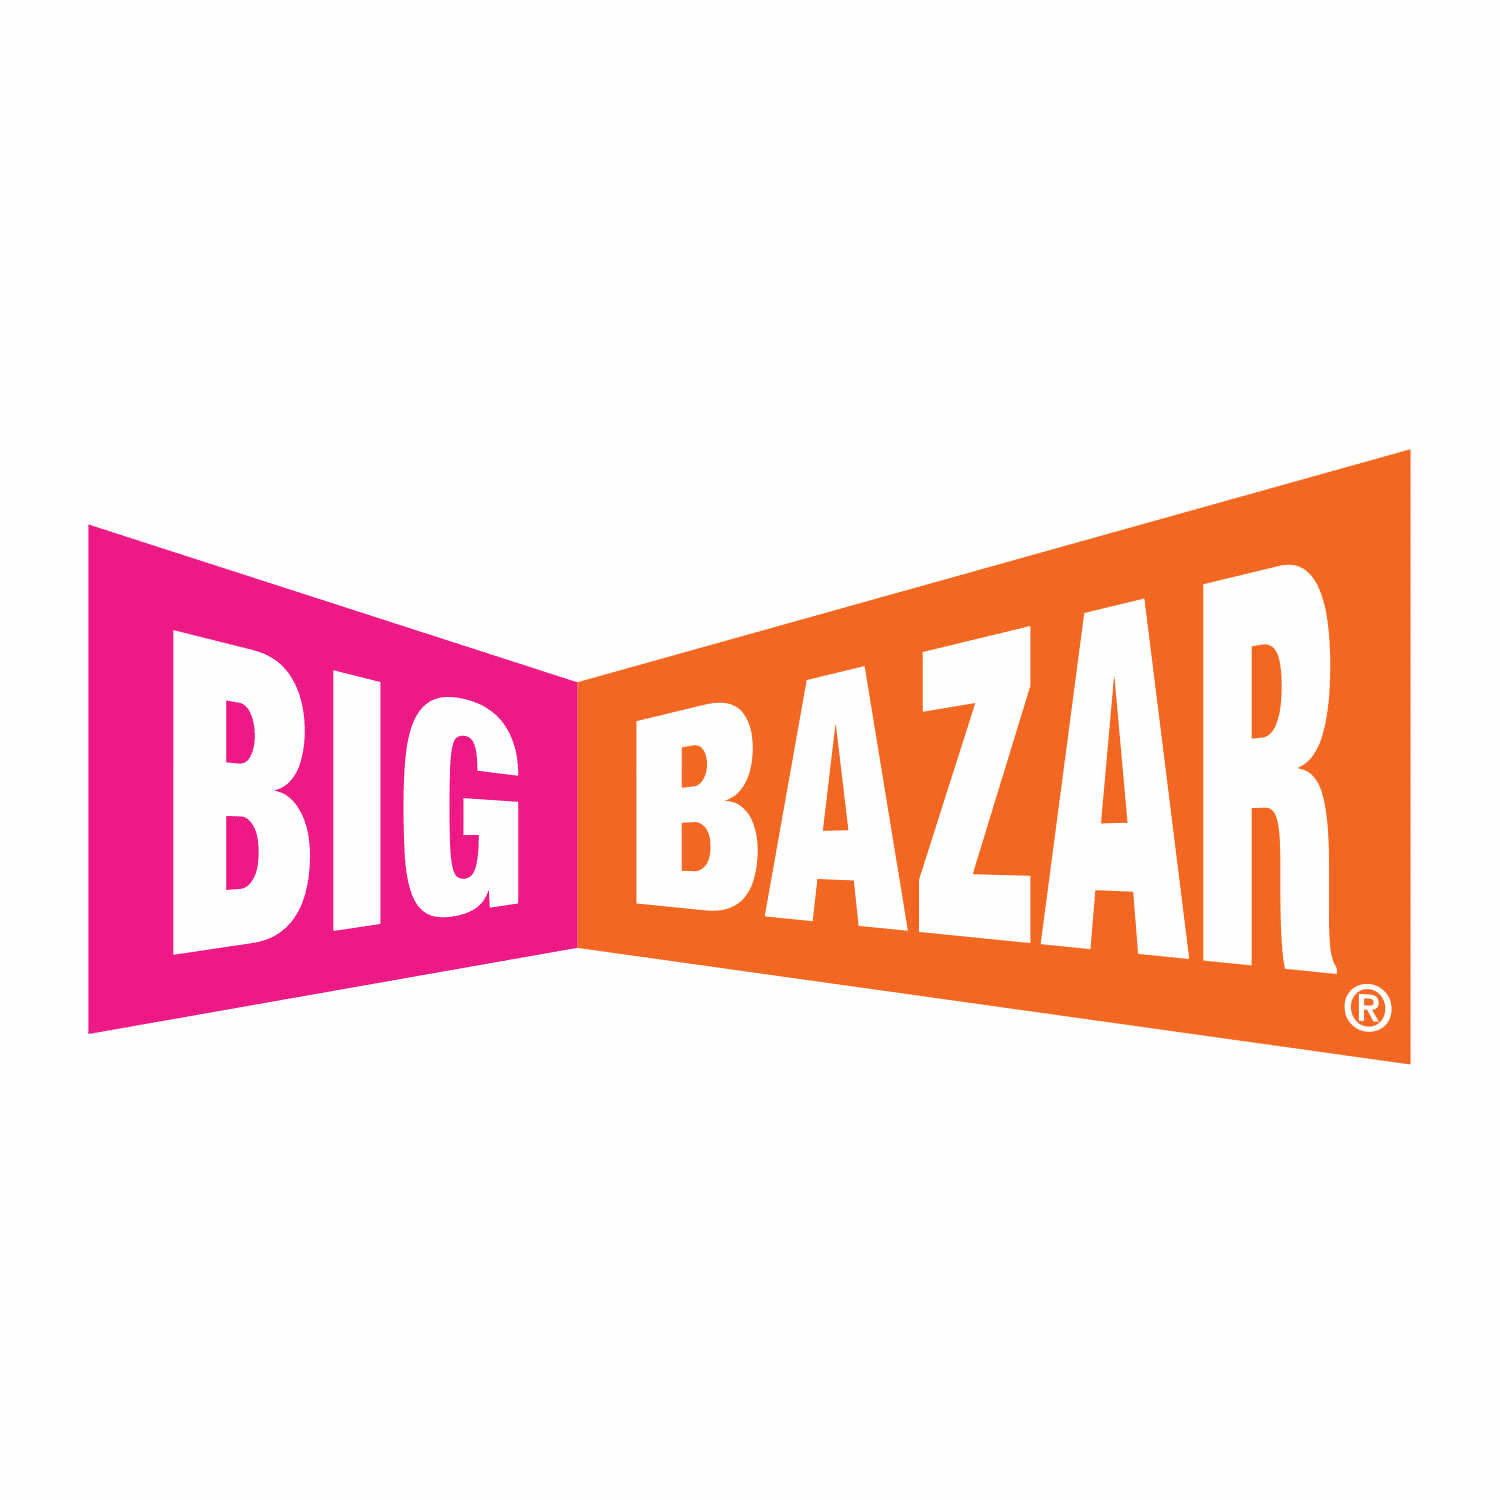
Big Bazar
Big Bazar was established in 2007 by Blokker, also a Dutch retailer, as a strategic response to Action’s rapid growth. Big Bazar shared numerous similarities with Action’s product categories, offering personal care products, perfumes, cleaning supplies, household and drugstore items, pet products, hobby and craft materials, and snacks and soft drinks, all priced below typical supermarket prices. At its peak, the company operated 135 stores across the Netherlands and Belgium, employing approximately 1,300 staff. However, Big Bazar ultimately faced insolvency. What went wrong, and what lessons can be derived to safeguard Action’s position?
In 2019, Michiel Witteveen acquired Blokker, including Big Bazar, through his Mirage Retail Group, following over 122 years of leadership under the Blokker family. Witteveen pursued aggressive expansion, planning to open 50 new stores in 2019, leveraging former Op=Op Voordeelshop locations (Op=Op Voordeelshop, with over 140 branches, went bankrupt earlier that year). Additionally, Witteveen sought to introduce the Chinese discount chain Miniso to the Netherlands, acquiring rights to open 50 stores (Retail Trends, 2019). As of 2025, however, Miniso’s website lists only 10 locations (Miniso, 2025).
Despite efforts to revive Big Bazar after its 2021 acquisition by Frisian entrepreneur Heerke Kooistra from Witteveen, the company was declared bankrupt in 2023.
Big Bazar’s mounting debts, owed to numerous creditors, were compounded by a significant decline in customer footfall in its final years. The bankruptcy report issued by the administrators (2023) outlined the following (translated):
According to Big Bazar’s management, post-acquisition in late 2021, the company faced multiple challenges, including COVID-19-related lockdowns, shifting consumer behavior, rising wages, rents, and other operational costs, retail financing difficulties, and the withdrawal of credit insurance coverage for suppliers. Management reported that these factors created a negative spiral, resulting in a loss-making operation and suboptimal inventory levels. This downward trajectory could not be reversed. The administrators are investigating the stated causes of the bankruptcy.
What stands out to me is the changing consumer behavior. This must be viewed specifically in the context of the Big Bazar concept. After all, Action continued to thrive, even during the COVID period despite the many restrictions.
From what I recall about Big Bazar, a significant portion of their product range was fixed—comprising a mix of A-brands and other labels, but with limited variation over time.
In conclusion, we can infer that Big Bazar failed to establish the critical success factors for a discount retail model: (1) a dynamic, surprising assortment offered at competitive prices, and (2) cost-conscious and efficient operations, particularly in inventory management and supply chain logistics—allowing these operational advantages to be passed on to the consumer.
These insights underscore the importance of adaptability and operational excellence to sustain competitive advantages in the (discount) retail sector.
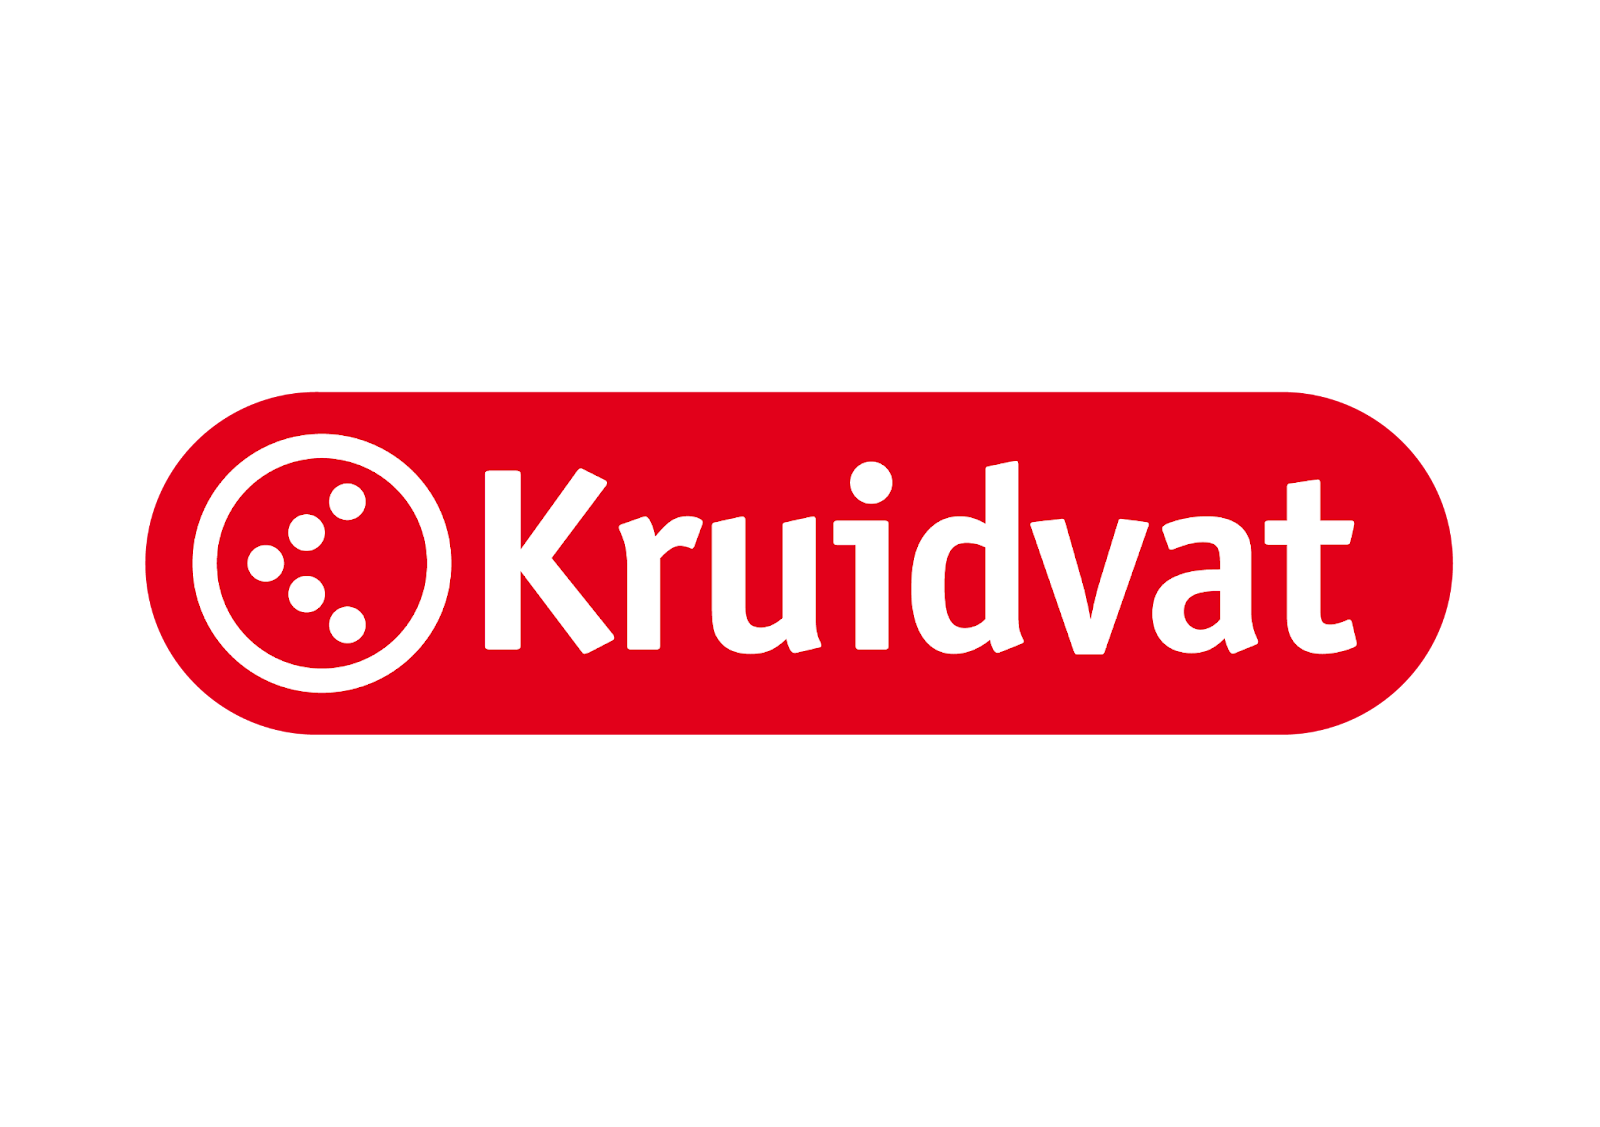
Kruidvat
In contrast to Big Bazar’s trajectory, The Dutch retailer Kruidvat, part of AS Watson Group, its business model aligns closely with its slogan (translated): Always Surprising, Always Affordable. This could have been the slogan of Action. Kruidvat has refined its concept effectively, despite maintaining a predominantly fixed assortment centered on personal care and cosmetics, primarily featuring A-brands. To complement this, Kruidvat incorporates rotating displays in its stores, showcasing thematic and seasonal products, as well as promotional offers. A portion of its core assortment is periodically discounted as part of these promotions—a strategy that diverges from Action’s approach of consistently low, fixed pricing. Beyond cosmetics, makeup, and snacks & soft drinks, Kruidvat also sells over-the-counter medications, a category Action does not cover, though Action does offer related products such as bandages and dietary supplements.
NORMAL
An international competitor to Action is the Danish retail chain NORMAL, established in 2013. NORMAL primarily focuses on personal care products and related items but also includes seasonal non-food products and snacks & beverages, such as imported confectionery. This creates a notable overlap with Action’s product assortment.
Operating under the motto Normal goods at fixed low prices, NORMAL targets everyday essentials, with a particular emphasis on female consumers—reportedly, 80% of its customer base is female (Berlingske, 2014). Its product range heavily features cosmetics, makeup, and perfumes, aligning with its target audience.
NORMAL adheres strictly to a fixed low-price strategy, ensuring products are consistently priced at the lowest possible level without promotional discounts. This approach mirrors Action’s pricing model, emphasizing predictable affordability.
At NORMAL, we sell completely normal goods at fixed low prices. The assortment includes well-known brands within categories such as skin care, hair care, oral care, shampoo, makeup, and cleaning. In short: All the things that you cannot do without in your everyday life and which should not be missing on the shelves in your home. All items are sold at fixed, low prices, meaning that you will not be able to find special offers and bargains with us. But what you can find for sure is lots of new and exciting items on the shelves. — NORMAL (2025)
Like Action, NORMAL recognizes the importance of a dynamic and surprising assortment to maintain customer engagement, regularly refreshing its product offerings to sustain interest:
Because NORMAL is much more than fixed, low prices and well-known brands. Our goal is that it should always be a new and unique experience to visit one of our stores. Even if it has only been a week since you last visited the store. That is why in NORMAL - in addition to the regular assortment of well-known branded products - there is a constant replacement and circulation of products on the shelves and podiums so you will always have new products to discover and explore. Our maze-like store set-up invites you to go treasure hunting among the many exciting items from well-known and unknown brands, and it is always easy to fill the shopping basket - without emptying your bank account. — NORMAL (2025)
However, NORMAL’s store layout appears less structured compared to Action’s. Shelves often appear to be arranged haphazardly, with products from different categories placed adjacent to one another. For instance, Kinder Bueno bars may be shelved next to dry shampoo, and Doritos chips positioned alongside men’s deodorant. This contrasts with Action’s more organized merchandising.
Does NORMAL pose a significant threat to Action?
NORMAL emerges as a formidable competitor, particularly given its rapid expansion and current scale. The chain operates over 850 stores across Scandinavia, Spain, Portugal, France, Italy, and the Netherlands, with new locations added weekly. Furthermore, NORMAL introduces approximately 100 new or established brand-name products to its assortment each week, reinforcing its appeal.
NORMAL’s stores, averaging 300 square meters, are notably smaller than Action’s, focusing on prime, high-traffic locations in bustling urban shopping districts, as emphasized by founder Mouritsen (Le Monde, 2022). This strategic choice maximizes visibility and accessibility but limits the breadth of inventory compared to Action’s larger-format stores.
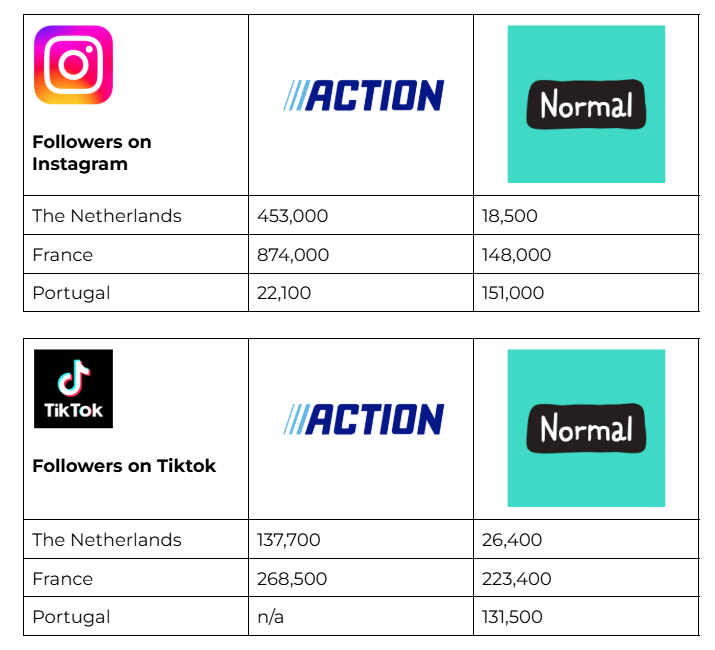
NORMAL employs a proactive social media strategy, producing localized video content in the native language of each market it serves, filmed in and around its stores. This approach aligns closely with Action’s social media tactics, which leverage the “treasure hunting” experience online to engage customers digitally.
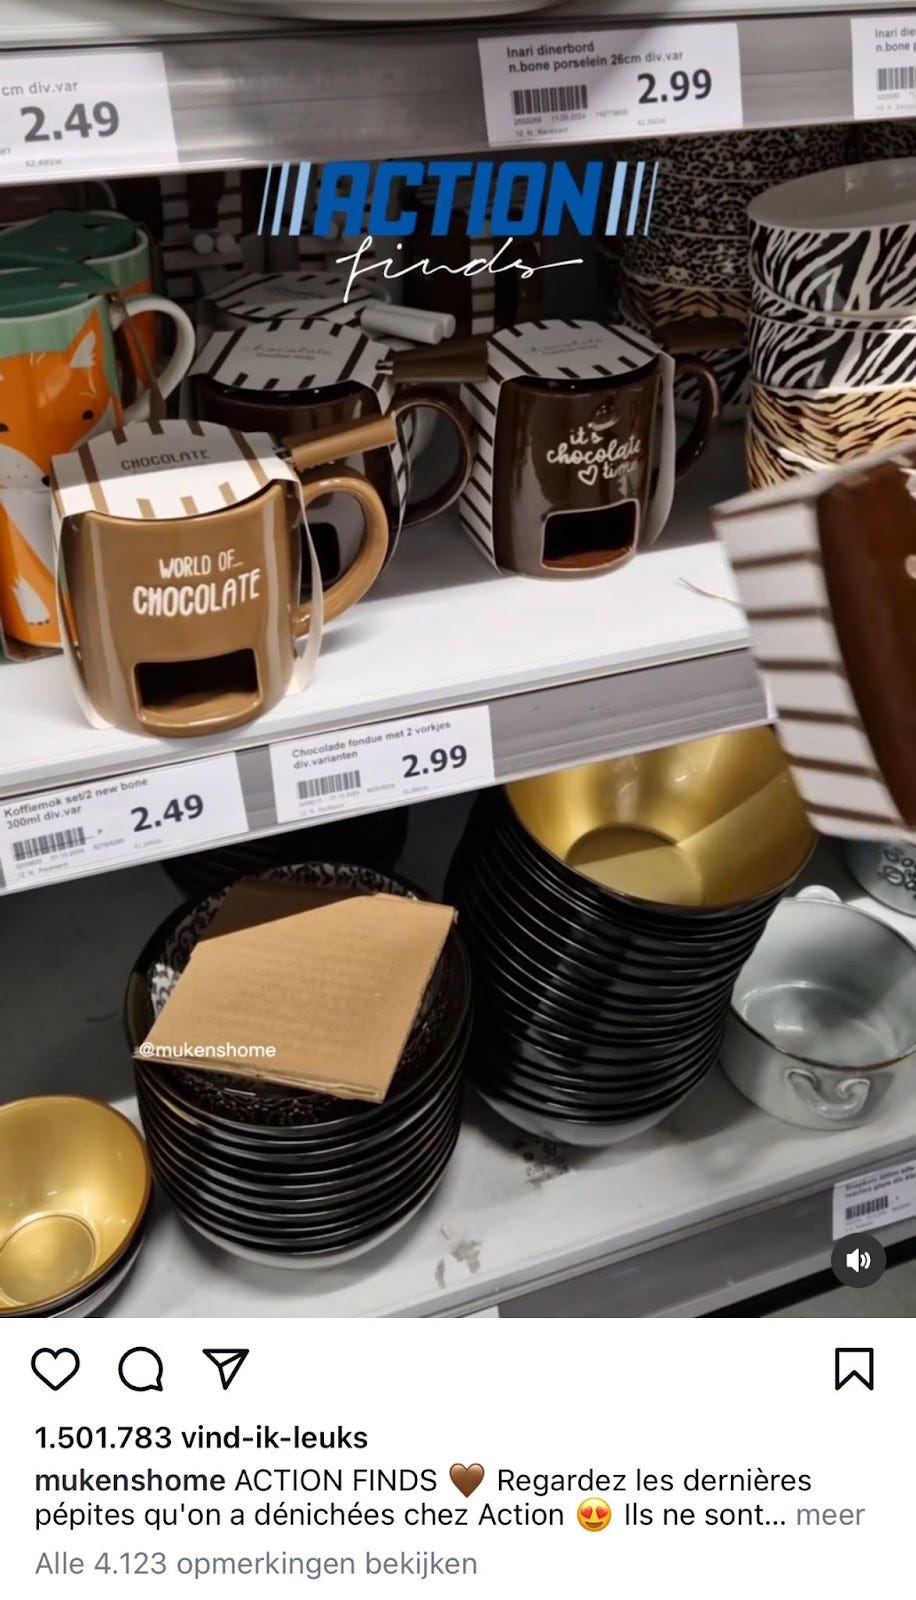
In addition to the official social media channels operated by both companies, there is also a notable presence of so-called fan accounts for both Action and NORMAL. These accounts are often run by individuals who regularly visit stores and create video content highlighting newly added products. This trend is commonly referred to as ‘Action finds’ in case of Action.
The phenomenon originated in the United States, where similar content is known as ‘Costco finds’. These videos tend to perform exceptionally well on social media platforms. Their appeal lies in the element of discovery, engaging viewers in a search for new bargains. The implicit incentive is that viewers may encounter attractive products, which in turn can drive additional foot traffic to physical store locations.
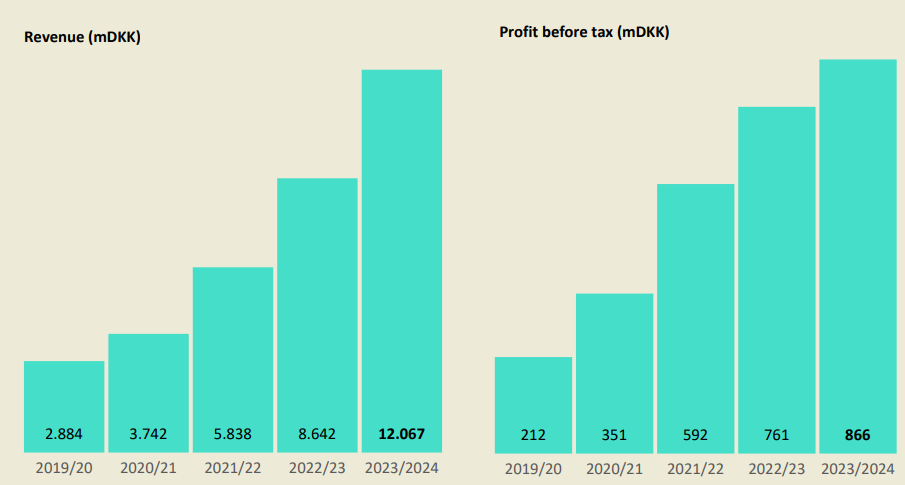
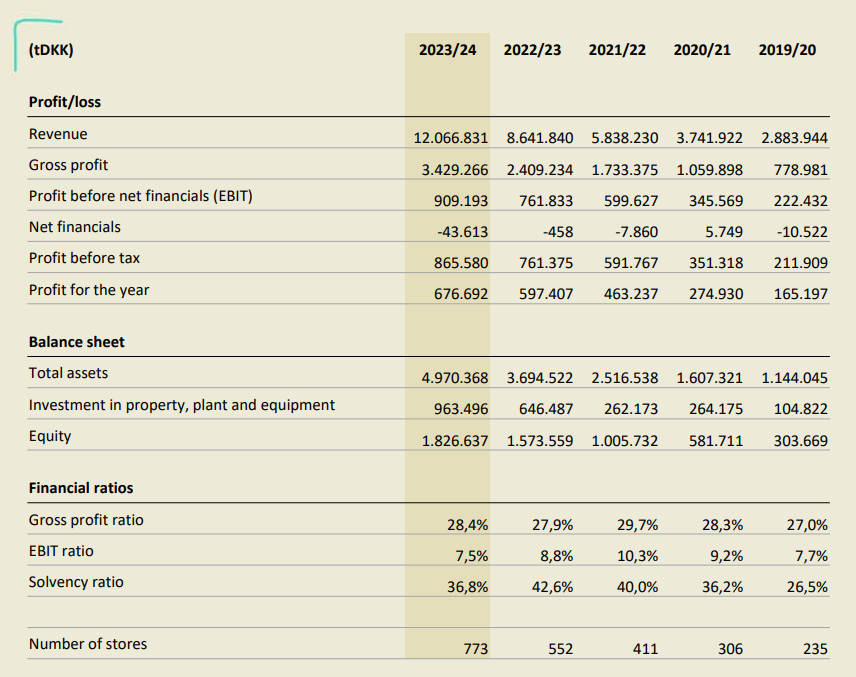
According to the most recent financial disclosures available, NORMAL provides insight into its financial performances. The graph presented above includes the progression of revenue and profit before tax, both reported in millions of Danish Krone (DKK). Below you can find the KPIs of NORMAL over the period from 2019/20 to 2023/24.
Further analysis of NORMAL as a risk factor for Action will be discussed later in this deep dive.
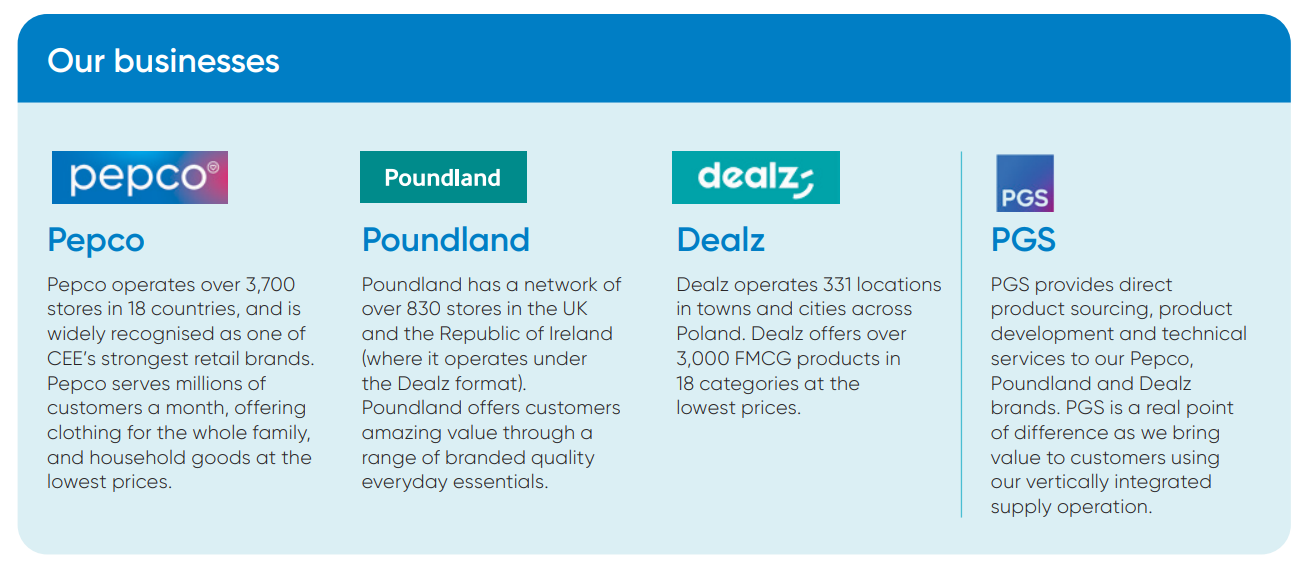
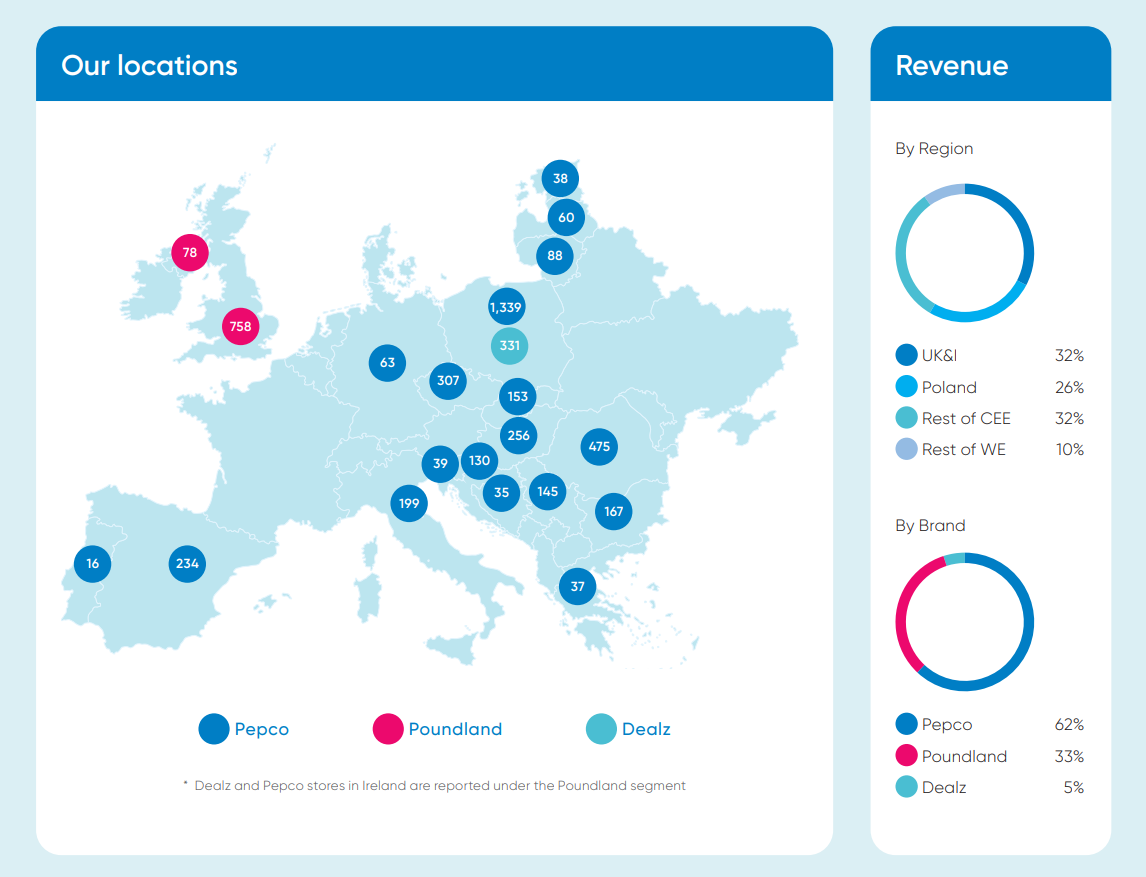
Pepco
The Pepco Group, with its HQ in Poland, encompasses the retail chains Pepco, Dealz, and, until recently, Poundland.
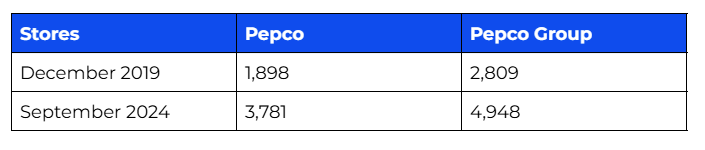
Pepco operates c.3,800 stores across Europe (Pepco, 2024). Its product assortment overlaps with Action’s, including household goods, toys, and personal care items, though Pepco also emphasizes various apparel categories. This aligns it more closely with the Dutch retailer HEMA, particularly in its pricing strategy, which favors whole-number pricing without decimals. However, Pepco’s stores are smaller than Action’s, with an average floor space ranging from 350 to 700 square meters (Pepco, 2025). According to Pepco’s FY2024 annual report (p. 22), the group’s total retail floor space spans 2,343,000 square meters across 4,948 stores, resulting in an average store size of approximately 474 square meters.
As of December 2019, Pepco operated 1,898 stores, with the Pepco Group managing a total of 2,809 locations (Pepco, 2020). This reflects significant growth over the past five years, underscoring the group’s expansion strategy.
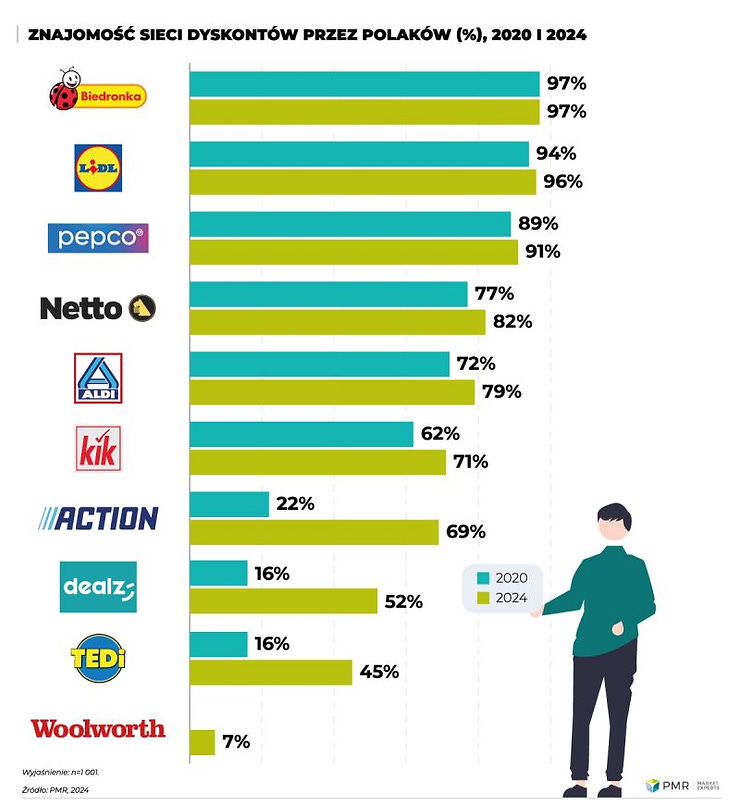
The development of brand awareness among Polish consumers for various retail chains in 2020 and 2024 (green) is illustrated in the figure below (PMR, 2024). In Poland, both Pepco Group’s Dealz and Pepco are active. Pepco’s brand recognition in Poland stayed almost the same at c. 90% over the past 4 years. Meanwhile, Action’s brand recognition surged from 22% in 2020 to 69% in 2024, driven by its robust expansion in the market. This growth has enabled Action to surpass Dealz, which entered Poland in 2018.
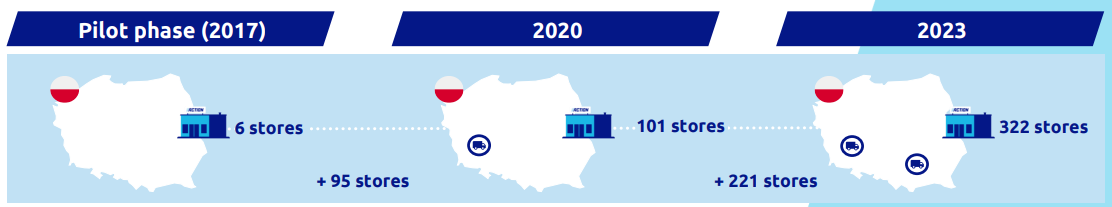
In 2017, Action entered the Polish market. By 2020, it operated 101 stores, growing to 322 stores by the end of 2023. As of the end of 2024, this number increased to 387 stores.

Dealz
Dealz is also a subsidiary of the Pepco Group, although slated for divestiture in the medium term as announced by the company. As of the end of 2023, Dealz operated 283 stores in Poland, offering a range of 3,000 fast-moving consumer goods across 18 product categories (Dealz, 2025). Unlike Action, which generally maintains fixed pricing (with the exception of weekly promotions), Dealz employs a discount-driven pricing strategy. Dealz’s product categories are comparable to those of Action. Until 2023, Dealz was active in Spain and France, but these operations were phased out in favor of Pepco stores. A similar transition occurred in Ireland in 2024.
Further details on the risks posed by Pepco and Dealz to Action are provided in the Risks chapter.
TEDi
TEDi, an abbreviation for Top Euro Discount, is a German discount retail chain with over 3,500 stores across 15 countries (TEDi, 2025; 2025). The first store opened in 2004, and by the end of its inaugural year, TEDi had established 120 new locations (TEDi, 2025). This reflects the company’s rapid expansion, with its current store count exceeding 3,500. TEDi has set an ambitious target to grow to 10,000 stores across Europe.
TEDi prioritizes A- or B+ locations in high-traffic neighborhoods, targeting towns and cities with at least 10,000 residents in the immediate vicinity or over 20,000 residents within a 15-minute travel radius. Its stores typically have a sales floor area ranging from 600 – 1,200 square meters (TEDi, 2025).
TEDi’s product assortment bears similarities to that of Action, including disposable party supplies, decorative items such as candles and pillows, stationery, household goods, personal care products like makeup and perfume, and toys. These are predominantly white-label and select private-label products, with minimal presence of A-brands noted on TEDi’s websites and brochures.
TEDi employs a distinct pricing strategy, as evidenced by its brochures and websites, focusing on unit pricing. The majority of its assortment is priced at €1. Further details on the risks posed by TEDi to Action are discussed in the Risks chapter.
Lidl
While not a direct competitor, the discount supermarket chain Lidl employs a similar concept in parts of its stores. In addition to overlapping with Action in its core categories—Food & Drinks, Laundry & Cleaning, Personal Care, and Pets—where Lidl has increasingly incorporated A-brands into its assortment in recent years, it also mirrors Action by offering a rotating selection of products in certain store sections.
Given Action’s broad range of daily necessities, some overlap with the assortments of supermarkets and other retail stores is inevitable. What distinguishes Lidl is its rotating offerings in product categories such as Do-it-Yourself (DIY), Garden & Outdoor, Clothing, Household & Goods, Stationery & Hobby, Health, and Toys & Entertainment—categories also offered by Action.
Lidl rotates these categories based on seasons and topical themes. For instance, Garden & Outdoor products dominate in spring, while Toys & Entertainment and Decoration items, such as candles, feature prominently during the holiday season.
Regular visitors to Lidl stores may notice that the store perimeters are typically dedicated to a fixed assortment, while the central or end aisles are reserved for a rotating selection, often featuring weekly promotions in the categories outlined above. This rotating assortment is depicted in purple as ‘Special Offers’ in the figure below.
History of Lidl
In 1930, Joseph Schwarz founded the food wholesaler Lidl & Schwarz KG in the German town of Neckarsulm, where the headquarters of Lidl’s parent company, the Schwarz Group, remains located today (Lidl, 2024).
While Action first expanded beyond its home country in 2005, Lidl, which opened its first modern store in Ludwigshafen in 1973, began its international expansion in April 1989 with its first store in France, located in Sarreguemines, just across the German border (ISN Magazine, 2022). Action followed 23 years later, opening its first French store in 2012. Lidl currently operates approximately 1,600 stores in France.
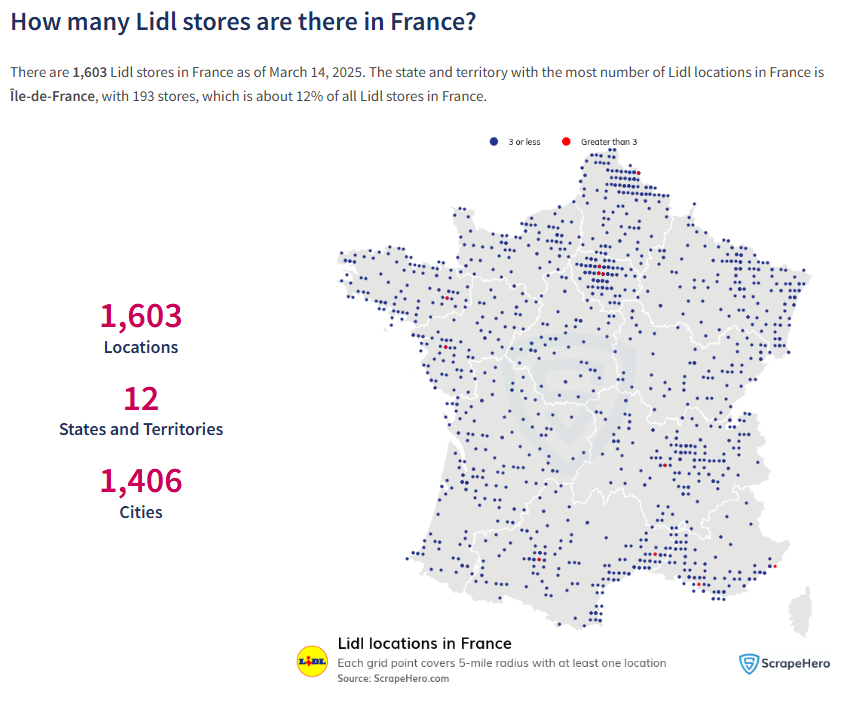
Of these approximately 1,600 supermarkets in France, 60% have a sales floor area between 300 m² and 1,000 m², while 40% range between 1,000 m² and 1,700 m² (Lidl, 2023). For comparison, an average Action store has a floor area of approximately 900 m². Action targets its stores to be positioned in areas with populations exceeding 40,000.
In France, with a population of approximately 66.6 million, Lidl’s 1,600 stores equate to roughly one store per 41,500 inhabitants.
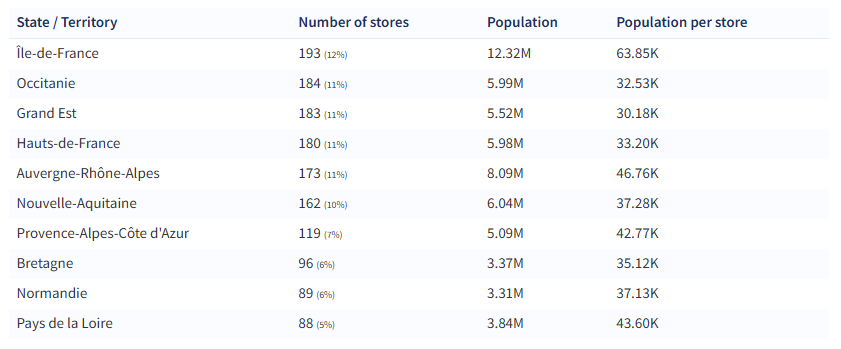
As of December 31, 2024, Action operated 859 stores in France, resulting in approximately 77,500 inhabitants per store. Excluding regions with low population density, Action has significant growth potential in France, with the company estimating a white space opportunity of approximately 35% as of March, 2025.
United Kingdom
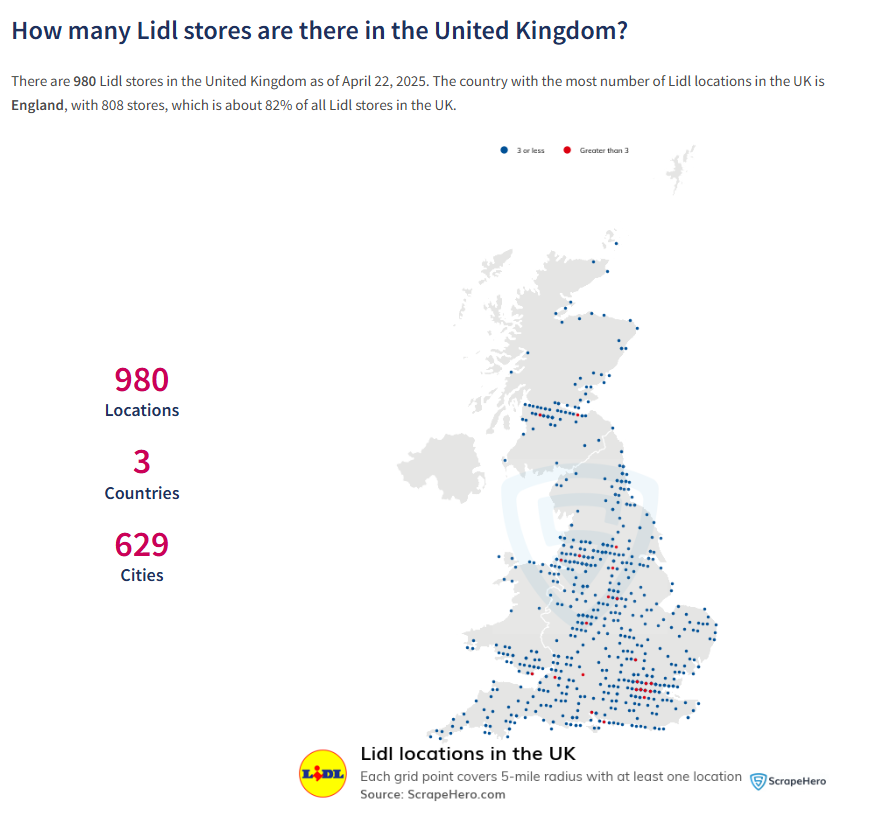
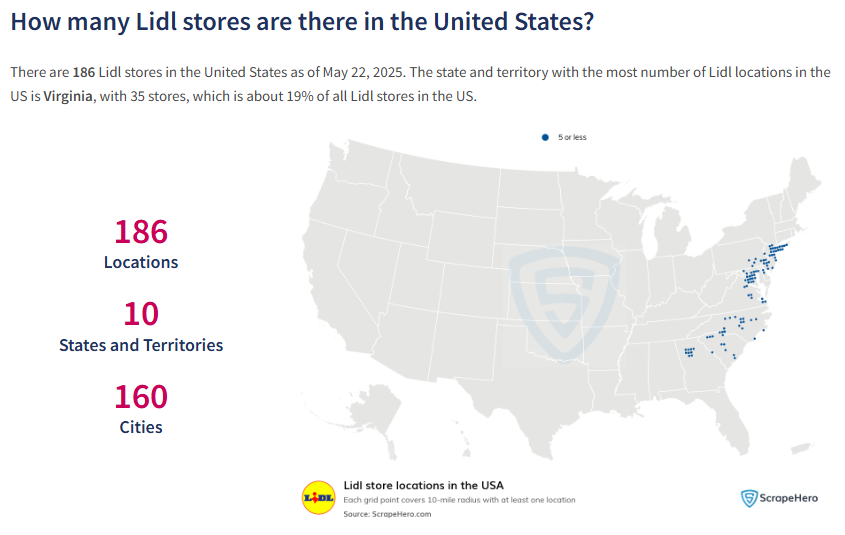
The United Kingdom is a market where Action is not currently active, but Lidl is. According to Lidl UK’s website (2025), the company operates over 980 stores across England, Scotland, and Wales, a figure consistent with ScrapeHero (2025). The figures below illustrates the distribution of Lidl stores in the UK and their customer reach.
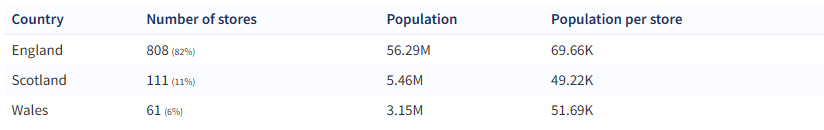
With approximately 68 million inhabitants in the UK, each Lidl store serves an average of 69,400 people.
Is the UK not a potential expansion opportunity for Action?
Chains such as Poundland (758 stores in the UK), B&M (over 700 stores in the UK), and Home Bargains (over 500 stores in the UK) have already established strong positions in the market. In my view, it is logical for Action to prioritize further expansion on mainland Europe, where there is greater white space and fewer well-established competing concepts. However, could the UK be a consideration for the future? Or might Action first pursue an entry into the United States?
United States
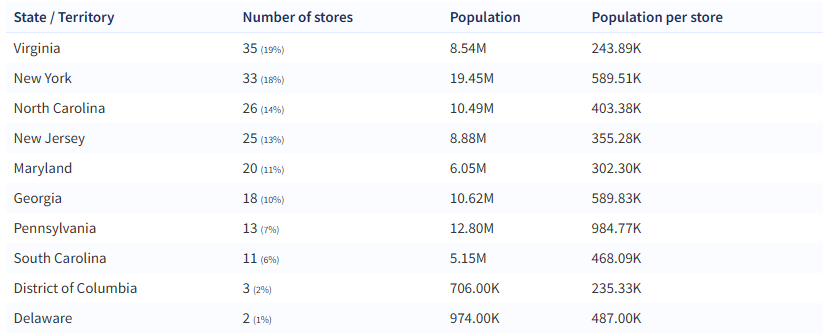
In 2017, Lidl opened its first store in the United States. As of 2025, the company operates approximately 186 locations along the East Coast (ScrapeHero, 2025).
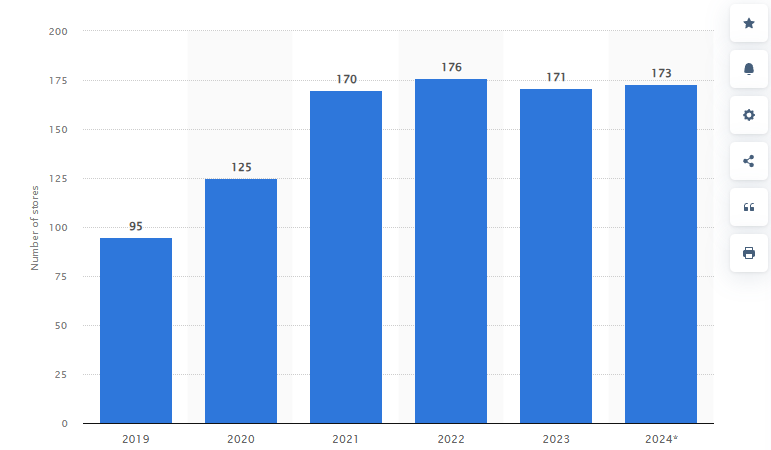
In contrast, Aldi’s overseas expansion in the U.S. has been significantly more robust, with 2,546 stores as of June 2025 (Aldi, 2025). Despite Lidl’s entry into the U.S. market in 2017, its store growth has stagnated in recent years (Statista, 2024). Aldi, having entered the U.S. market earlier in 1976 with its first store in Iowa (Aldi, 2025), has established a stronger footprint.
In the United Kingdom, Aldi operates approximately 1,044 stores, slightly outpacing Lidl’s 980 stores. While Aldi maintains a larger presence in both the U.S. and the UK, Lidl dominates on the European mainland, offsetting its smaller scale in the U.S. and UK markets. This positions Lidl as the marginally larger entity compared to Aldi globally.
In FY2024, Aldi (Nord + Süd) reported global revenues of €121 billion (€32 billion + €89 billion, +6% YoY) (Distrifood, 2025; Aldi South Group, 2025). Lidl, by comparison, recorded revenues of €132.1 billion (+5.3% YoY) (Schwarz Group, 2025). The broader Schwarz Group, which includes Lidl, achieved total revenues of €175.4 billion (+4.9% YoY). In comparison, Action reported revenues of €13.8 billion in FY2024.
Key Insights
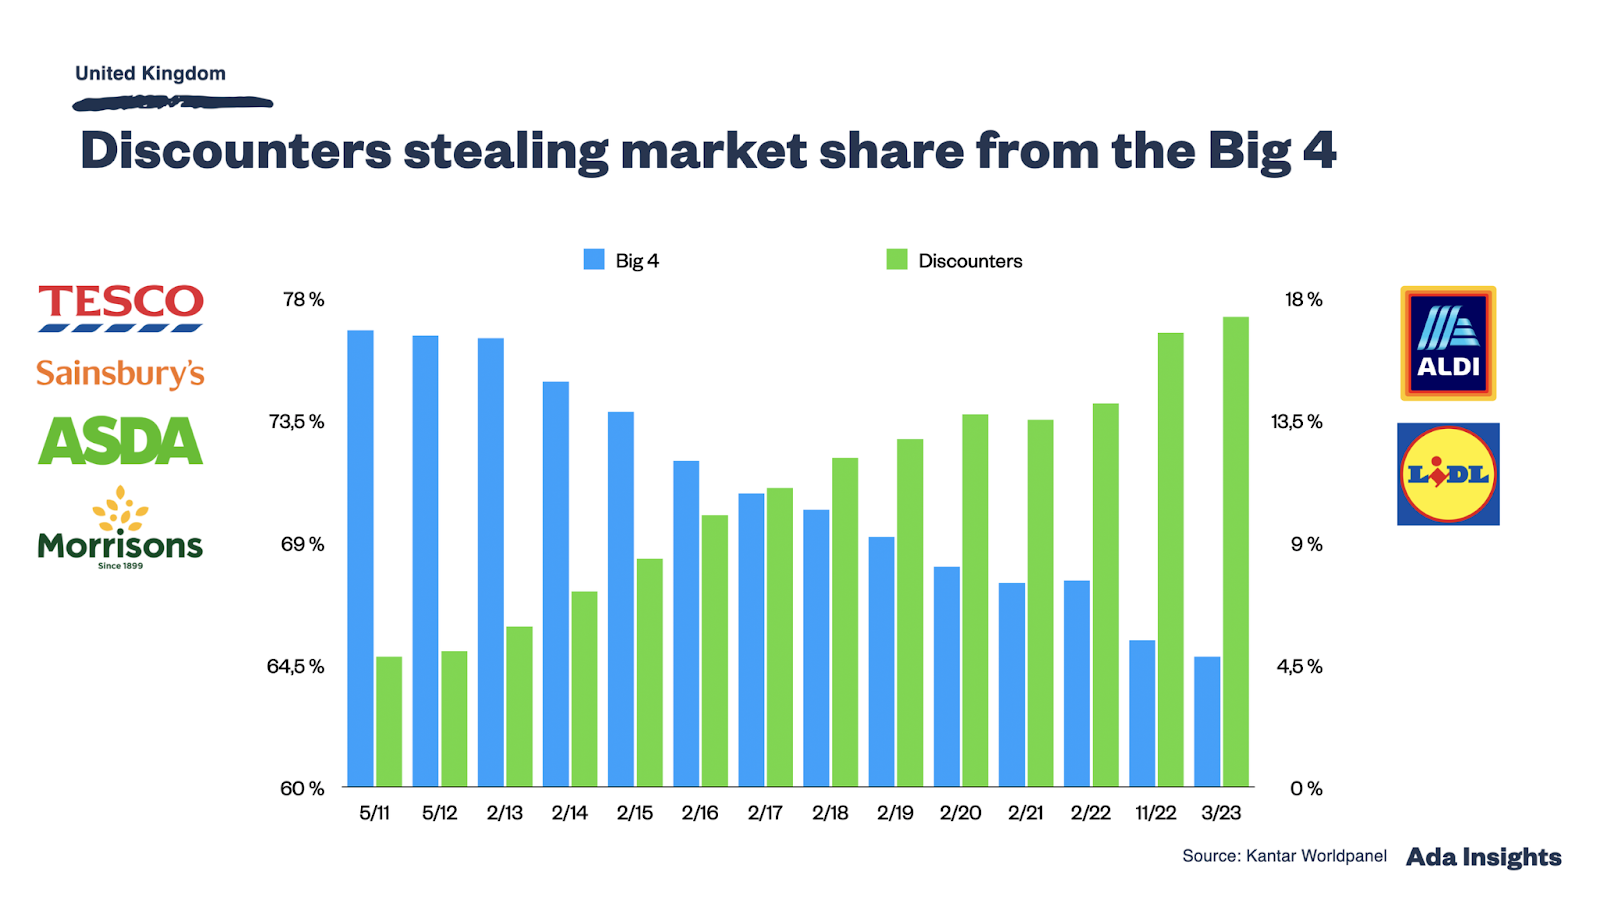
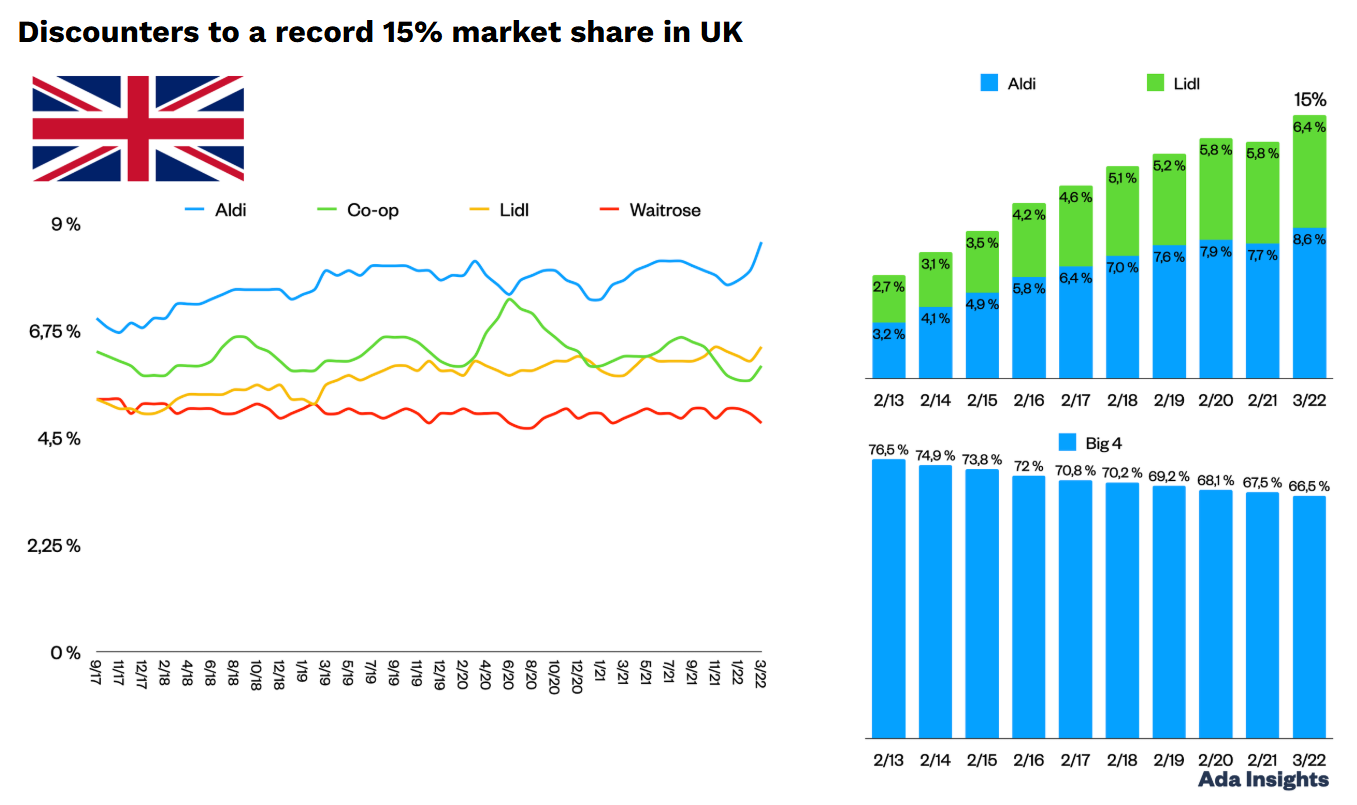
We learned that discount retailers, such as Aldi and Lidl, are steadily capturing market share from traditional retail chains, including established supermarkets and drugstores.
The chart below illustrates the market share of discounters (Aldi and Lidl) compared to the Big 4 (Tesco, Sainsbury’s, ASDA, and Morrisons) in the United Kingdom. Note that the Y-axes have been adjusted to highlight trends more clearly. Between 2011 and 2023, the Big 4’s market share declined from 76% to 64%, while Aldi and Lidl’s combined market share rose from 5% to 17%.
Was Lidl’s U.S. entry in 2017, over 40 years after Aldi’s, simply too late? Potentially, though, Aldi's U.S. market share remains modest at 2.1%, compared to Lidl’s 0.3% (Dunnhumby, 2023).
According to Dunnhumby’s research, Aldi’s relative success in the U.S. over Lidl stems from several factors:
A 40-year head start, allowing Aldi to capitalize on competitive and dynamic market conditions in the 1970s, 1980s, and 1990s.
Lidl’s choice to launch its U.S. expansion in 2017 on the East Coast, a region where Aldi was already well-established.
Despite Lidl’s lag, Dunnhumby notes that Lidl has “strengths to rest on,” citing its “excellent prices and a strong private brand portfolio.” However, the report highlights a “slight misalignment between customer needs, assortment, and store experience,” noting that “in an intensely competitive landscape [...], slight misalignments are going to matter.
Dunnhumby suggests that with patience, Lidl could succeed in the U.S. but “will need to capitalize on its personalization engine, revisit its marketing communications with customers to establish a more clearly differentiated, and establish a foothold in the West before Aldi does.”
Should Action consider entering the U.S. or UK markets, it could benefit from studying the growth trajectories and challenges faced by Lidl and Aldi in their expansions.
4.7 | Financials
In the calendar year 2024, Action’s revenue grew to €13.8 billion, reflecting a 21.7% increase from 2023, following a 27.8% growth in the previous year compared to 2022. Of this growth, 10.3 percentage points were driven by organic like-for-like (LFL) revenue growth from existing stores, primarily due to higher transaction volumes. This volume growth accounted for 102% of the LFL growth.
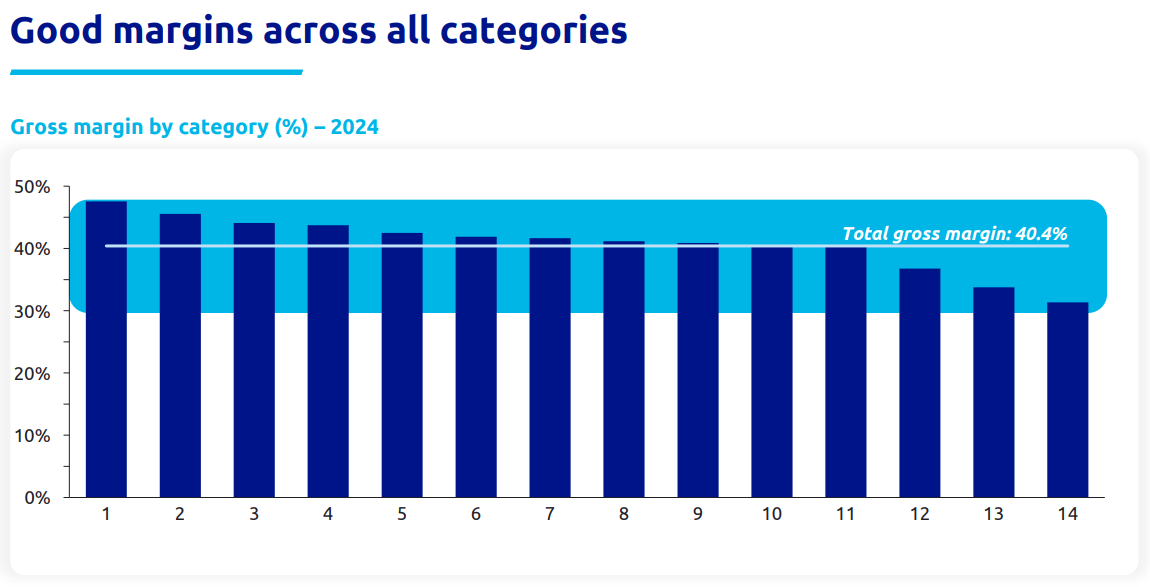
In 2024, Action achieved an average gross margin of 40.4% across its product categories, as illustrated in the figure below.
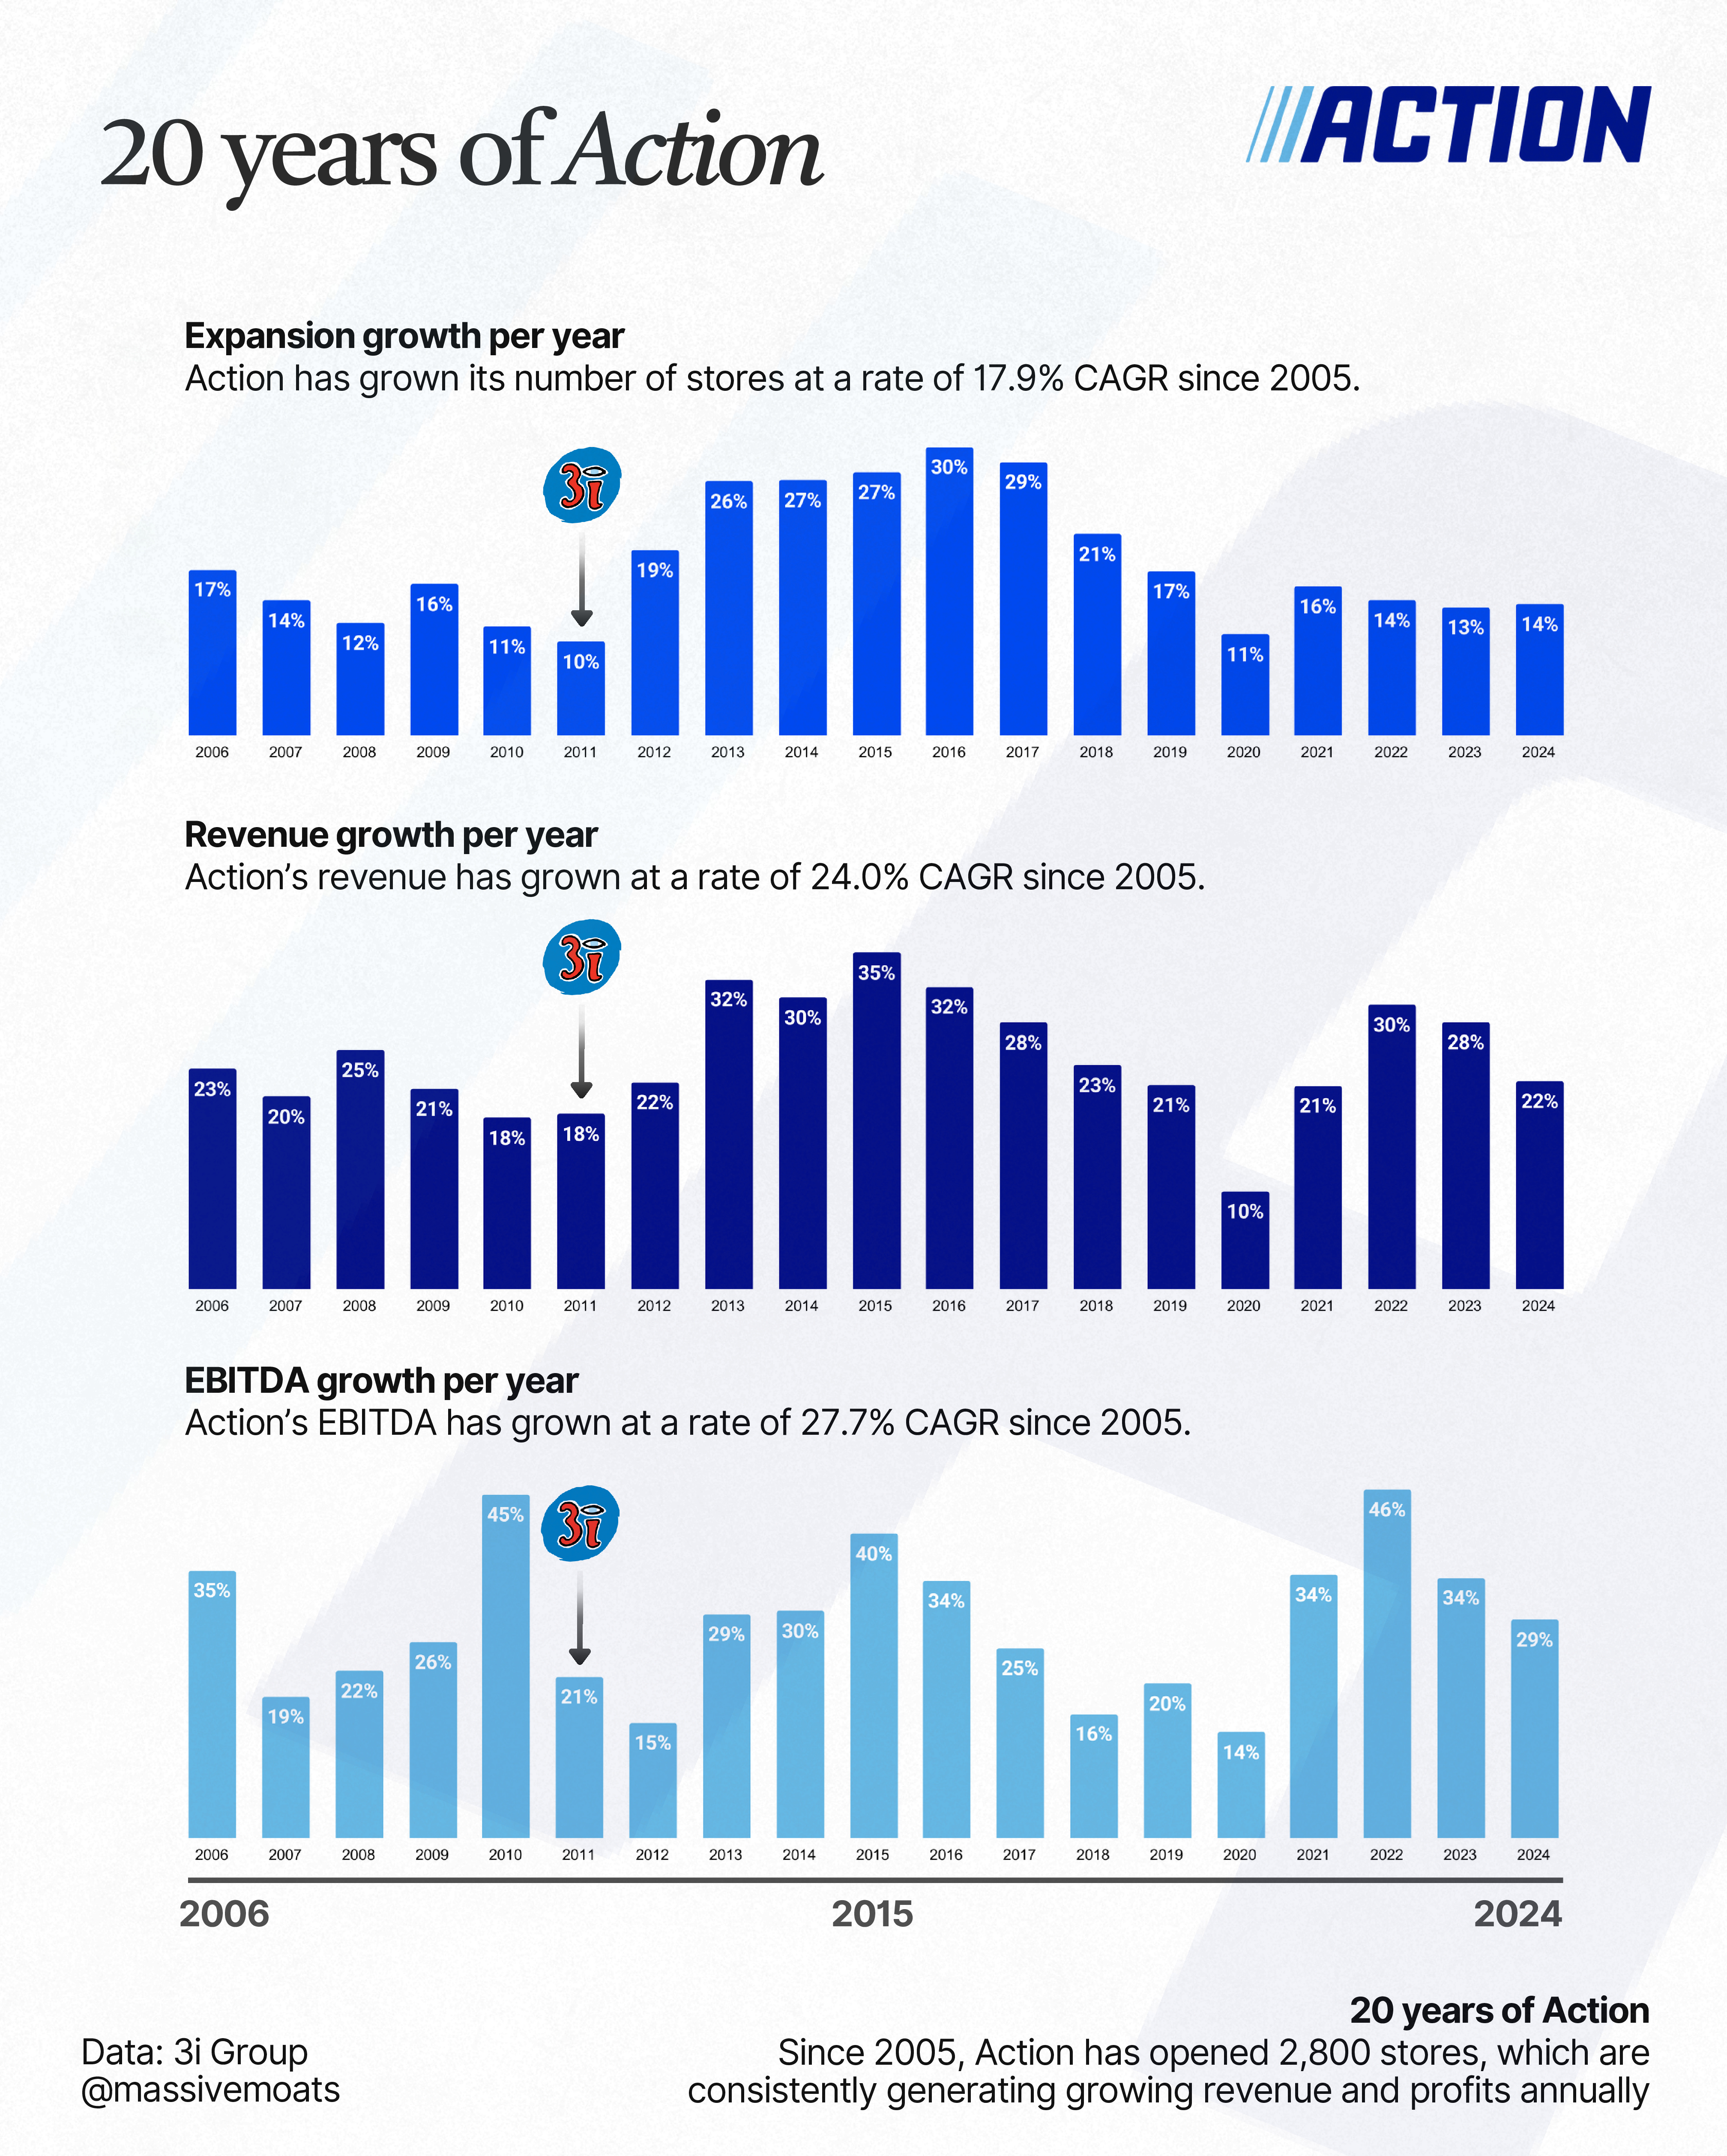
Action’s operational EBITDA rose from €1,205 million in 2022 to €1,615 million in 2023, and further to €2,076 million in 2024, representing year-over-year increases of 34% and 29%, respectively. The figure below depicts the evolution of Action’s operational EBITDA since 2005.

With operational EBITDA growing faster than revenue, Action’s operational EBITDA margin improved from 10.6% in 2019 to 15.1% in 2024. For context, this margin hovered around 9% in the years prior to 2010.

Since the buyout of Action by 3i Group in 2011, revenue has grown at a CAGR of 25.5%, operational EBITDA at 27.8% CAGR, and the number of stores at 20.1% CAGR. These growth rates were significantly lower in the period prior to the acquisition, up to 2011. For instance, store count grew at a CAGR of 13.3% from 2005 to 2011. The involvement of 3i Group has clearly accelerated Action’s growth trajectory.
The figure below illustrates the year-over-year growth from expansion, total revenue growth, and operational EBITDA growth since 2006.
According to 3i Group, Action’s rising profitability is driven by economies of scale from its expansion and a disciplined focus on cost control.
Economies of Scale
As Action expands its store network, it increasingly benefits from economies of scale. The mechanism operates as follows.
Action incurs fixed costs at its headquarters and distribution centers. By spreading these largely fixed overhead costs across a growing number of stores, the proportion of these costs relative to revenue decreases, thereby enhancing the operational profit margin.
Additionally, individual stores also face fixed costs, such as labor, rent, and utilities. As Action’s brand recognition and market penetration increase in a given region, its stores generate higher sales volumes. This boosts the profitability contribution of each store to the group.
For instance, with a stable base of daily customers, an additional customer incurs no incremental fixed costs, allowing the gross profit from their purchases to flow almost entirely to operational profit. In essence, each additional euro of revenue per store is more profitable than the initial euros earned.
Furthermore, expanding its store network enables Action to optimize organizational efficiency and strengthens its negotiating power with suppliers, its buying power, further driving cost efficiencies.
In the calendar year 2024, Action increased its store count by 352, reaching a total of 2,918 stores by December 31, 2024. On June 5, 2025, the company celebrated the opening of its 3,000th store in San Rocco al Porto, Italy (Action, 2025).
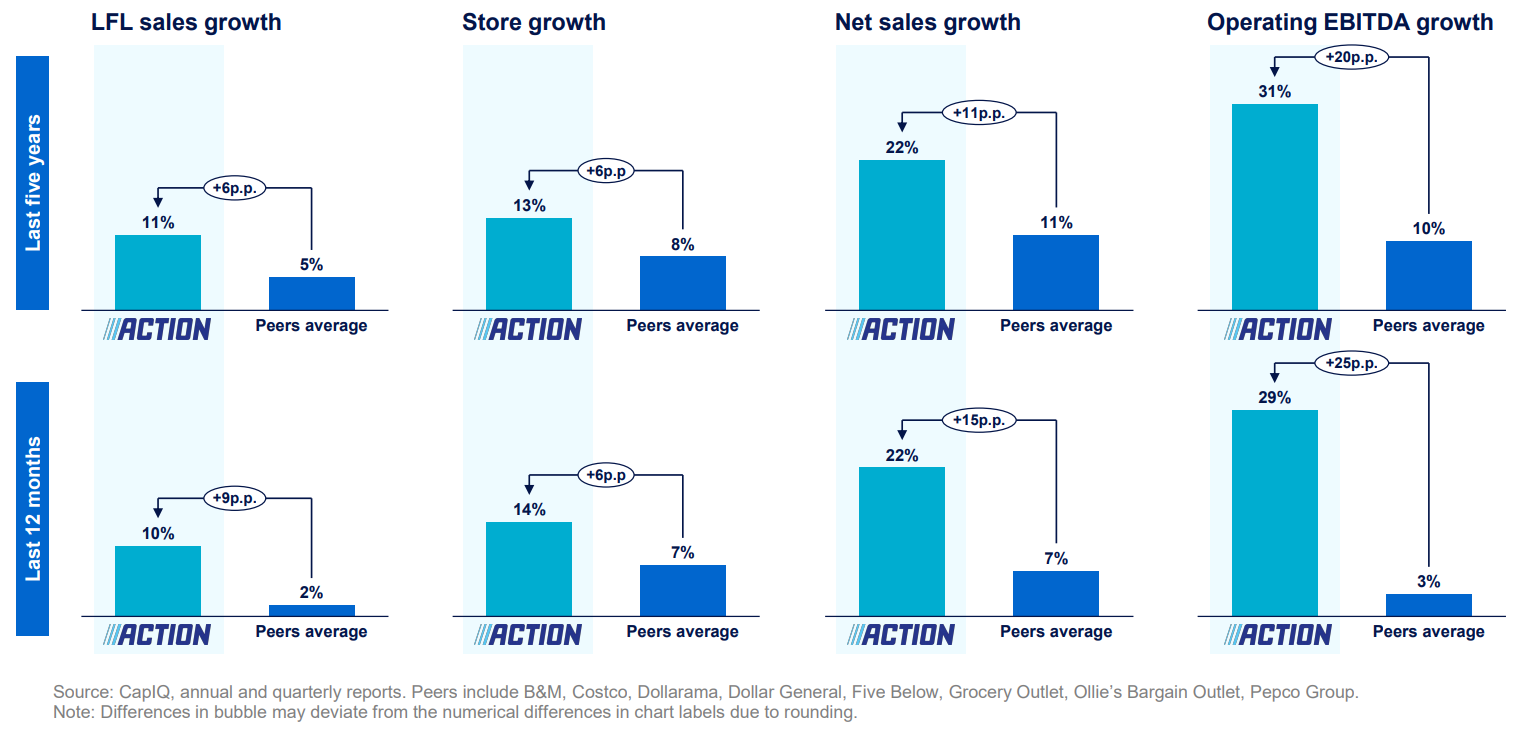
In the above charts, Action compares itself to its peers, including B&M, Costco, Dollarama, Dollar General, Five Below, Grocery Outlet, Ollie’s Bargain Outlet, and Pepco Group. It should be noted that Action is significantly smaller in scale than most of these competitors and remains in a robust expansion phase. Nevertheless, the comparison highlights Action’s growing ‘market share’ within a collective (notional) total market of these retailers.
The contribution margin of Action’s stores in countries where it was active prior to 2019 increased significantly over the period from 2019 to 2023.
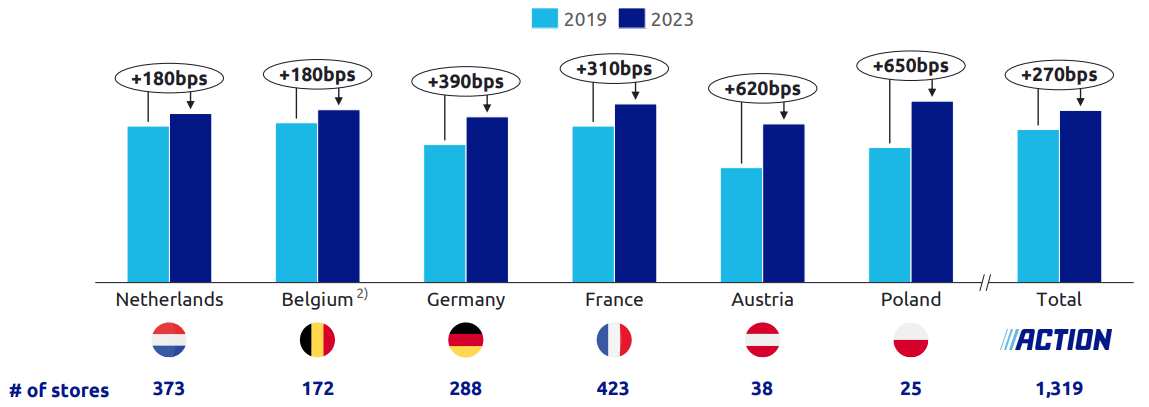
The contribution margin is calculated by deducting direct costs in these countries—such as labor, rent, and other sales and store-related expenses—from gross profit, excluding headquarters and supply chain costs. The average contribution margin of Action’s stores reached 24.7% in 2024 (2023: 24%) as illustrated in the figure below. This indicates a notable improvement in the profitability of Action’s stores over recent years.
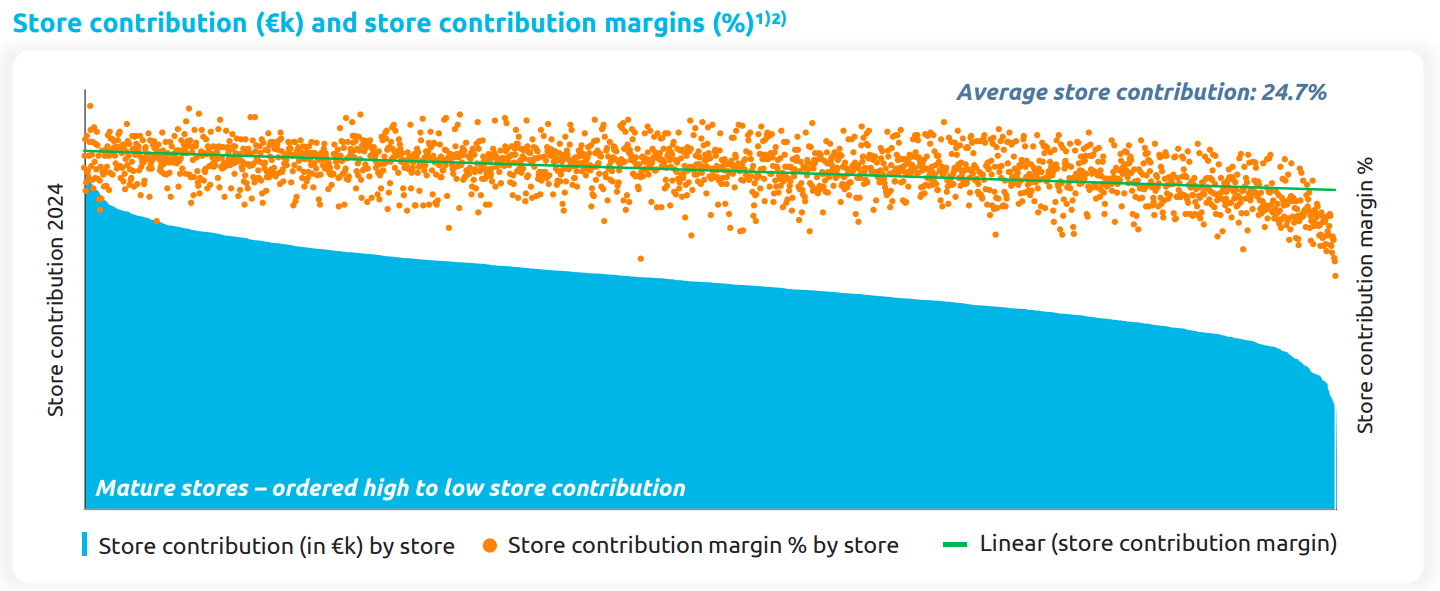
The table above includes Action’s mature stores, defined as those open for at least two years at the time of compilation. The blue bars represent the absolute contribution in euros, starting with Action’s most profitable store. The orange dots above indicate the contribution margin, expressed as a percentage of total revenue per store.
As observed, the percentage margin generally increases slightly as the absolute contribution in euros—and thus absolute revenue—rises. Stores with lower revenue typically exhibit a marginally lower contribution margin. However, one fact remains clear: all of Action’s mature stores (open for 2+ years) are profitable.
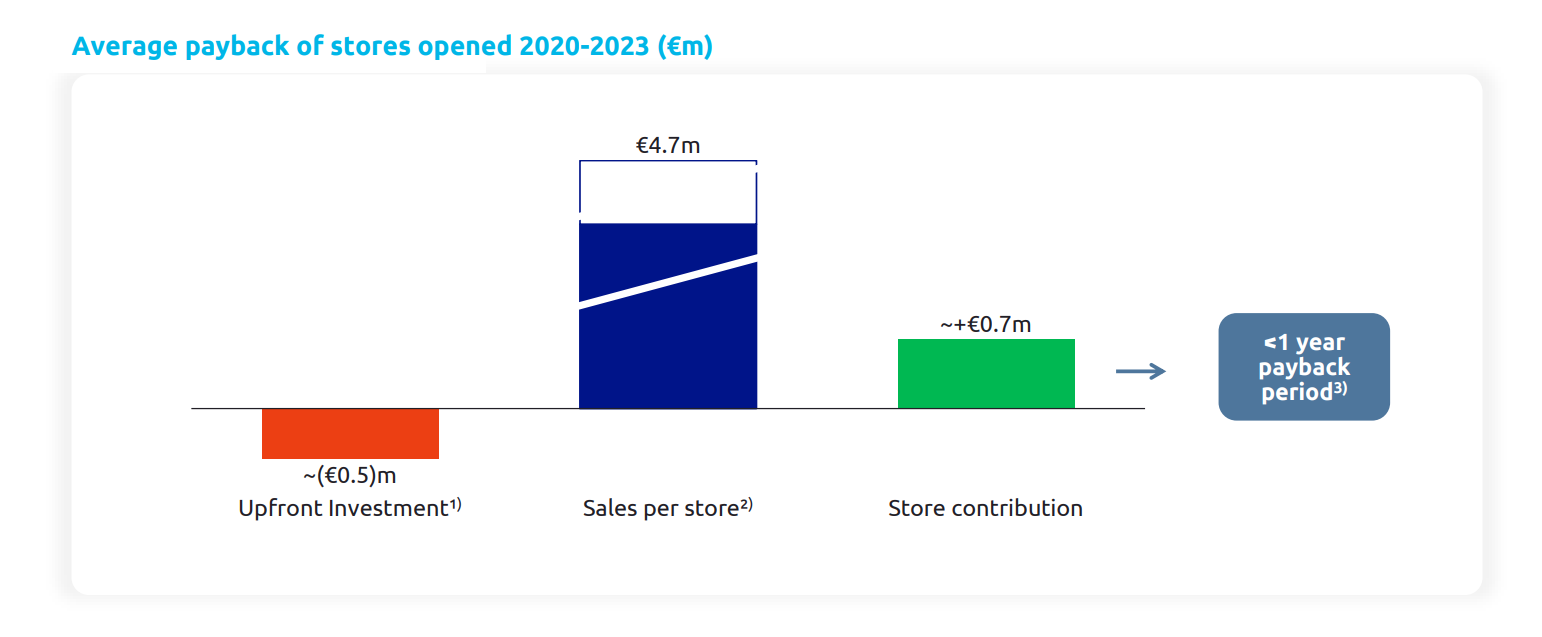
The chart above illustrates the average payback period for newly opened Action stores. The upfront capital expenditure (CAPEX) investment required to open a store has averaged €0.5 million in recent years, with an estimated amount of approximately €614,000 in 2024. Based on the average contribution margin of newly opened stores from 2020 to 2023, of approximately €0.7 million per year, the average payback period is less than one year.
This underscores the compelling nature of Action’s business model: it is highly scalable due to relatively low upfront CAPEX, delivers a high return on investment (ROI), and results in an exceptionally short payback period.
The above refers to the contribution that a new store adds to Action’s overall performance, excluding costs incurred at headquarters and in the supply chain to support these operations. Consequently, the net contribution margin will be lower. Nevertheless, the data demonstrates that Action has established a highly profitable and scalable business model.
The table below shows an increasing number of stores achieving a contribution margin exceeding 20%.
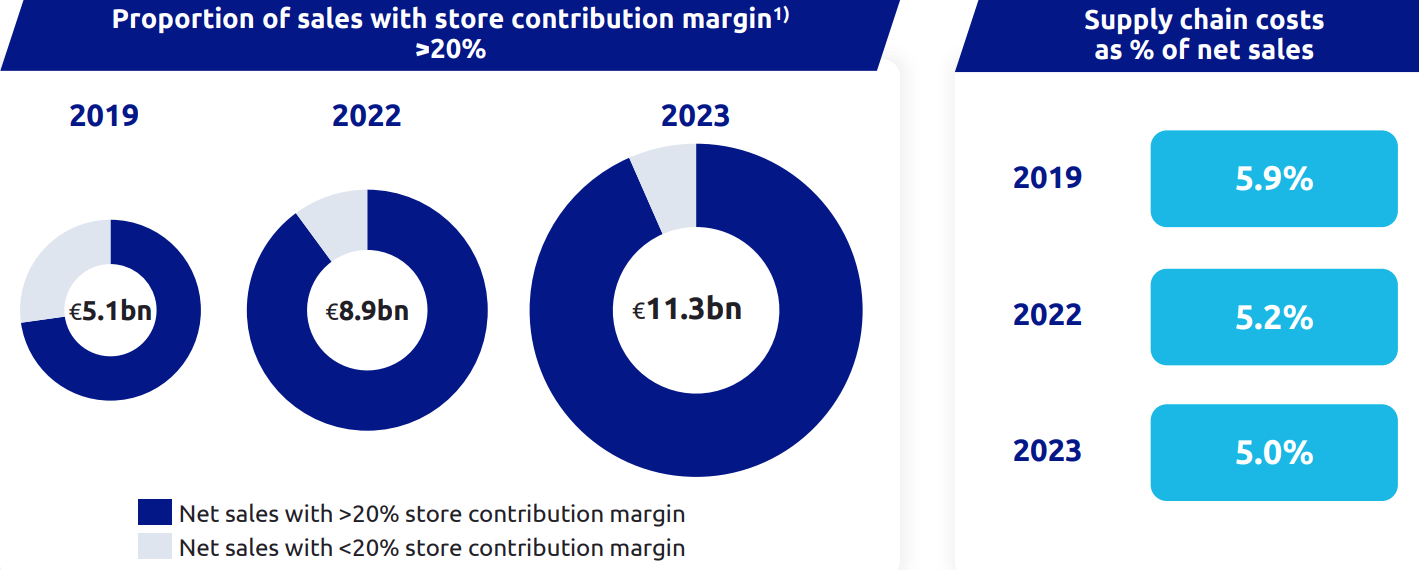
The right-hand side of the figure above displays the supply chain costs as a percentage of revenue. This percentage decreased from 5.9% in 2019 to 5.0% in 2023.
When allocating supply chain costs across all Action stores, the average net contribution margin for the group is 19% (24% -/- 5%). To derive the EBITDA margin for the entire Action group, headquarters-related costs must be deducted.
With an EBITDA margin of 14.3% in 2023, these headquarters costs accounted for approximately 4.7% of Action’s total revenue. In 2024, the EBITDA margin increased to 15.1%.
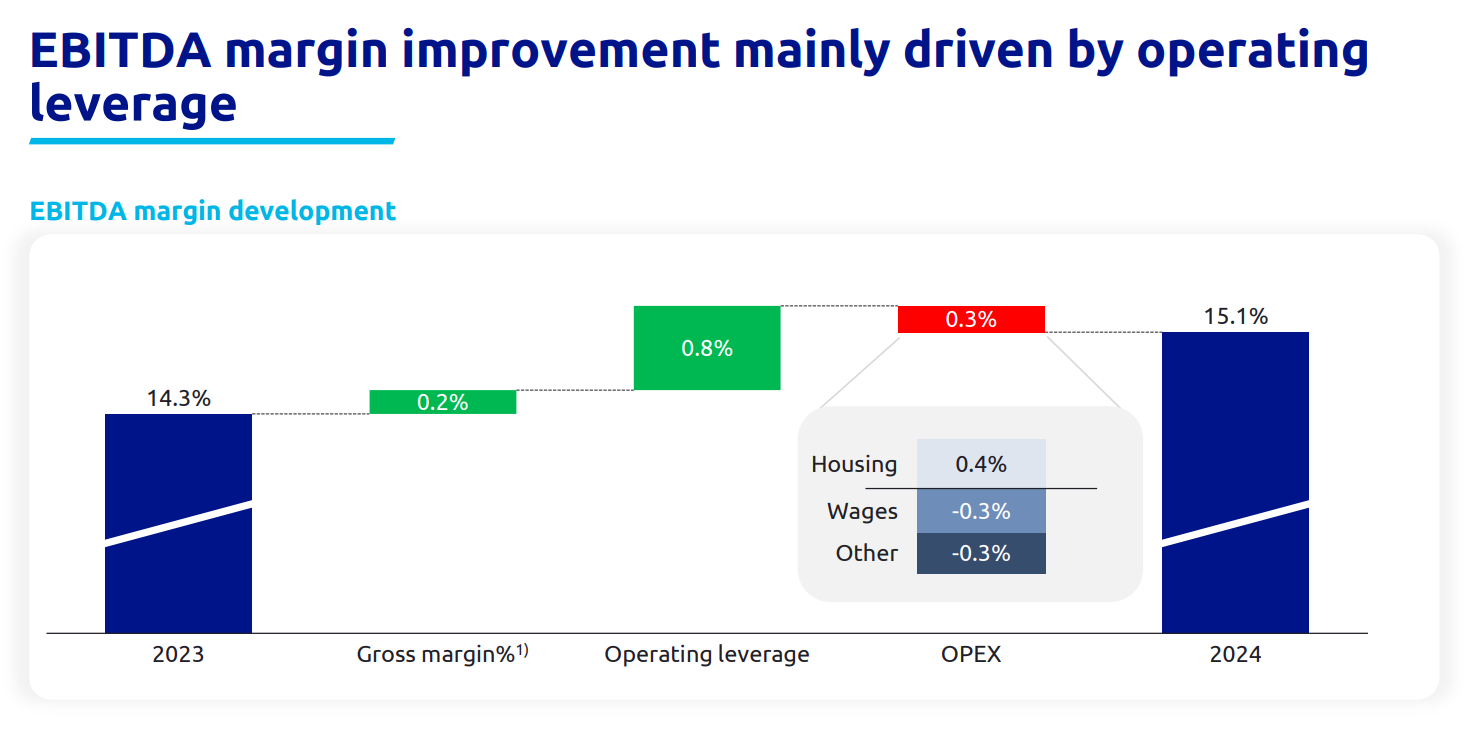
The figure above includes the 2024 EBITDA bridge. In addition to a 0.2 percentage point gain from a higher gross profit margin, the EBITDA margin improved by 0.5 percentage points year-over-year on an operational basis (net, including increased operating costs).
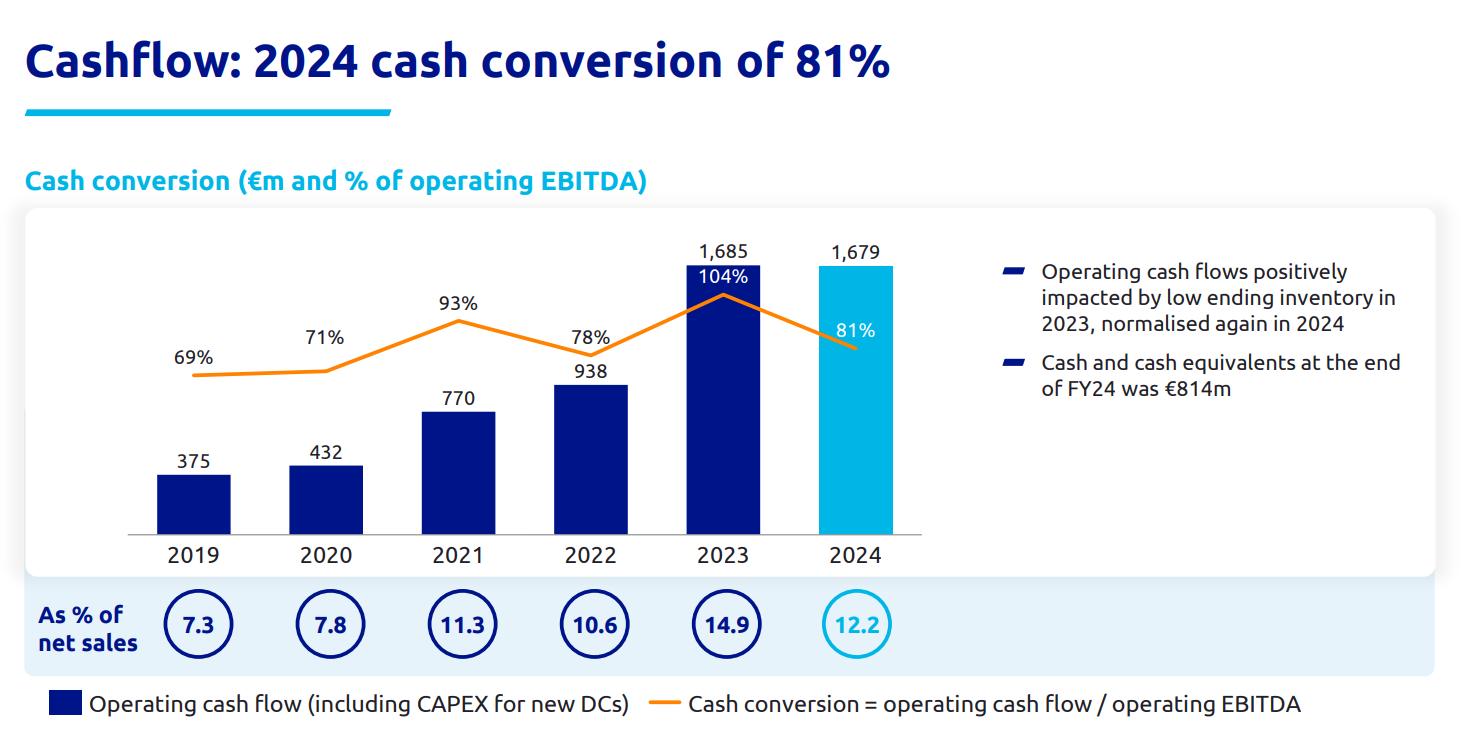
The conversion of operational EBITDA to operating cash flow in 2024 was 81%. This indicates that for every euro of operational EBITDA, Action generated €0.81 in operational cash flow (including CAPEX for new distribution centers). The decline compared to 2023 stems from a normalization of inventory levels, which in 2023 had a low year-end balance that positively contributed to that year’s cash flow conversion.
Income Statement
Below is a condensed version of Action’s income statement for the fiscal year 2024, presented starting from operating EBITDA.
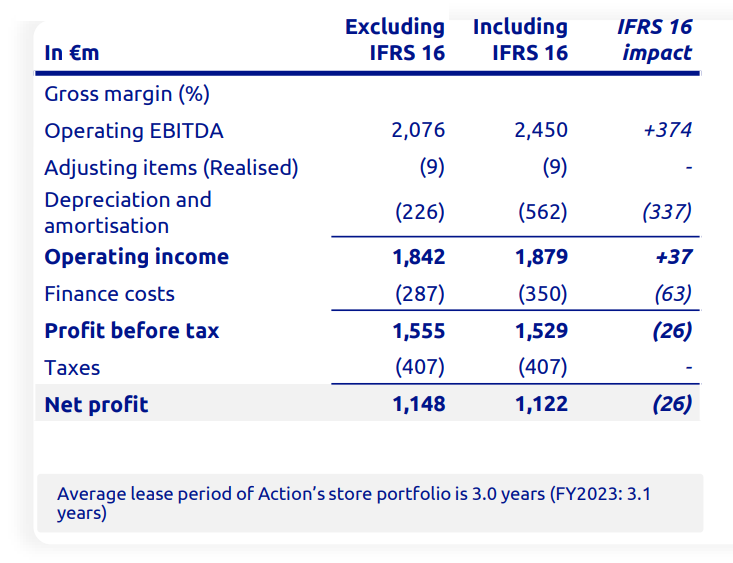
For its stores, Action enters into lease agreements with an average lease term of 3.0 years (2023: 3.1 years). Action reports financials both including and excluding IFRS 16.
IFRS 16
IFRS stands for International Financial Reporting Standard. IFRS 16 specifically addresses leases, requiring the lessee—in this case, Action—to recognize future lease obligations in its financial reporting. This is recorded as a right-of-use asset on the asset side of the balance sheet, representing the future lease benefits, and as lease liabilities on the liability side, reflecting future lease obligations.
In the income statement, under the IFRS 16 perspective, this results in a higher operating EBITDA, as lease-related costs are now classified under depreciation (D) within EBITDA (amortized from the right-of-use asset balance on the balance sheet). Additionally, the interest costs, which form part of the net lease expenses, are recorded under interest (I).
As a shareholder, it is critical to focus on metrics that incorporate the depreciation of leases and interest components in the profit figures. In my analysis, I have used operating EBITDA figures excluding IFRS 16.
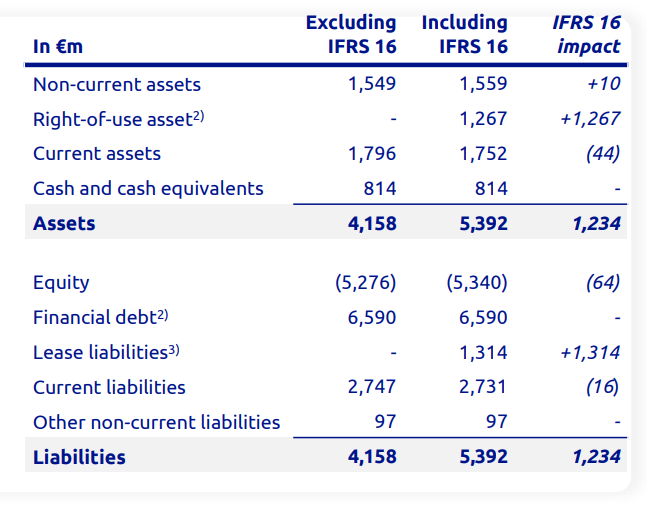
Balance Sheet
Below is a simplified representation of Action’s balance sheet as of the end of December 2024.
4.8 | Management & Culture
Action’s management team consists of the following individuals:
Hajir Hajji, CEO (since January 2022);
Joost Sliepenbeek, CFO (since November 2018).
Action has a one-tier governance structure, comprising the 2 executive directors mentioned above and the following 8 non-executive directors:
Simon Borrows (Board Chair Action, 3i Group);
Menno Antal (formerly 3i Group);
Marc van Gelder;
Boris Kawohl (formerly 3i Group);
Sameer Narang;
Ulrich Wolter;
Jasi Hala (3i Group);
Rutger Vos (3i Group).
As CEO of 3i Group, Simon Borrows also serves as the Chair of Action’s Board of Directors. Below is a profile of Hajir Hajji, CEO of Action.

Hajir Hajji (CEO, Action)
Hajir Hajji (44) has been the CEO of Action since 2022, with a long-standing career within the company. She began in 1997 at the age of 17, applying for a position at Action’s 13th store at Waterlandplein in Amsterdam, where she worked as a weekend employee (SER, 2019). Her responsibilities included “stocking shelves, operating the cash register, and assisting customers. It was incredibly hard work,” Hajji noted in an NRC interview (2017). Despite the demands, she found great enjoyment:
I started my career at Action when I was 17 during a gap year in between two studies. As store employee at Action’s 13th store in Amsterdam, I learnt the ropes, quickly got more and more responsibilities, and had so much fun. I grew into new roles and bigger responsibilities quite naturally and rapidly – something that we still cherish at Action, because we look at drive and competencies and offer our colleagues internal promotion opportunities. — Hajir Hajji (LinkedIn, 2025)
In 2011, Hajji took on responsibility for Action’s international retail operations, including the opening of new stores and expansion into new markets. She became Chief Commercial Officer in 2018 before succeeding Sander van der Laan as CEO in 2022. Van der Laan served at Action from 2015 to 2022 as CEO (LinkedIn, 2025).
80,000 Employees
Action’s management oversees more than 80,000 employees representing 151 different nationalities (Action, 2025, 2025). In 2024, Action created 10,641 new jobs, compared to 8,988 in 2023. This reflects Action’s ongoing rapid growth phase. One of the challenges associated with this expansion is maintaining a healthy company culture.
Our colleagues are the beating heart of Action. It is important to us that our colleagues enjoy working at Action – because of the teamwork, the strong customer focus, and pride in being part of the Action brand. We all work together to grow Action. And as Action grows, we all develop and grow with the company. It’s important that our workforce is as diverse as the communities where we work. We believe having different perspectives adds value. We offer everyone a chance to work for Action, regardless of their background. With over 80,000 colleagues across 13 European countries, from 151 different nationalities, Action provides work opportunities for a vast and growing number of people. — Action (2025)
Culture
Action’s culture can be described as dynamic, characterized by hard work (ranging from ‘occasional’ to ‘intense’), with elements of competition and opportunities for promotion. It also fosters job satisfaction, enjoyment, and a sense of fulfillment, supported by positive relationships with colleagues.
On Glassdoor (2025), Action has an average rating of 3.1/5 based on 302 reviews, with 43% of reviewers recommending employment at Action to an acquaintance. CEO Hajir Hajji receives an approval rating of 58%.
Negative feedback on Glassdoor primarily focuses on the demanding nature of the work: “It’s really hard work, honestly.” However, the same reviewer, a sales associate with five years of working experience, highlighted that the job was “super fun to do.”
Management → Targets
In March 2020, during the Capital Markets Day (3i Group, 2020), the following 2023 targets were set for Action:
Revenue of approximately €9.0 billion;
Operating EBITDA exceeding €1.0 billion;
Approximately 2,750 stores.
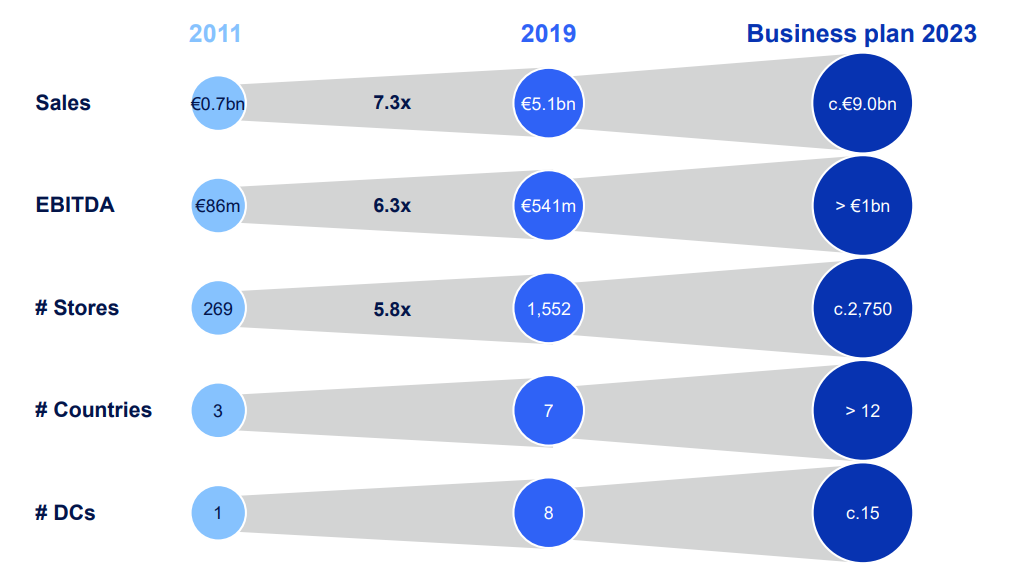
Targets → Performance
Action significantly surpassed its 2023 revenue and operating EBITDA targets set in 2020. The key figures are as follows:
In 2023, Action achieved revenue of over €11.3 billion, exceeding the 2020 target by approximately €2.3 billion.
Operating EBITDA reached over €1.6 billion, surpassing the 2020 target of >€1.0 billion by approximately €0.6 billion.
Action ended 2023 with 2,566 stores, falling short of the target of approximately 2,750 stores by 184.
Shortly after Action established its FY2023 targets in early 2020, the COVID-19 pandemic emerged, requiring the company to adapt to unprecedented challenges. In 2020, Action opened only 164 stores, a significant decrease from the 227 opened in 2019.
Government restrictions further impacted operations, including temporary store closures in certain countries and limitations on the product assortment offered.
Despite these challenges, Action successfully exceeded its FY2023 revenue and operating EBITDA targets set in 2020, demonstrating resilience and strong performance.
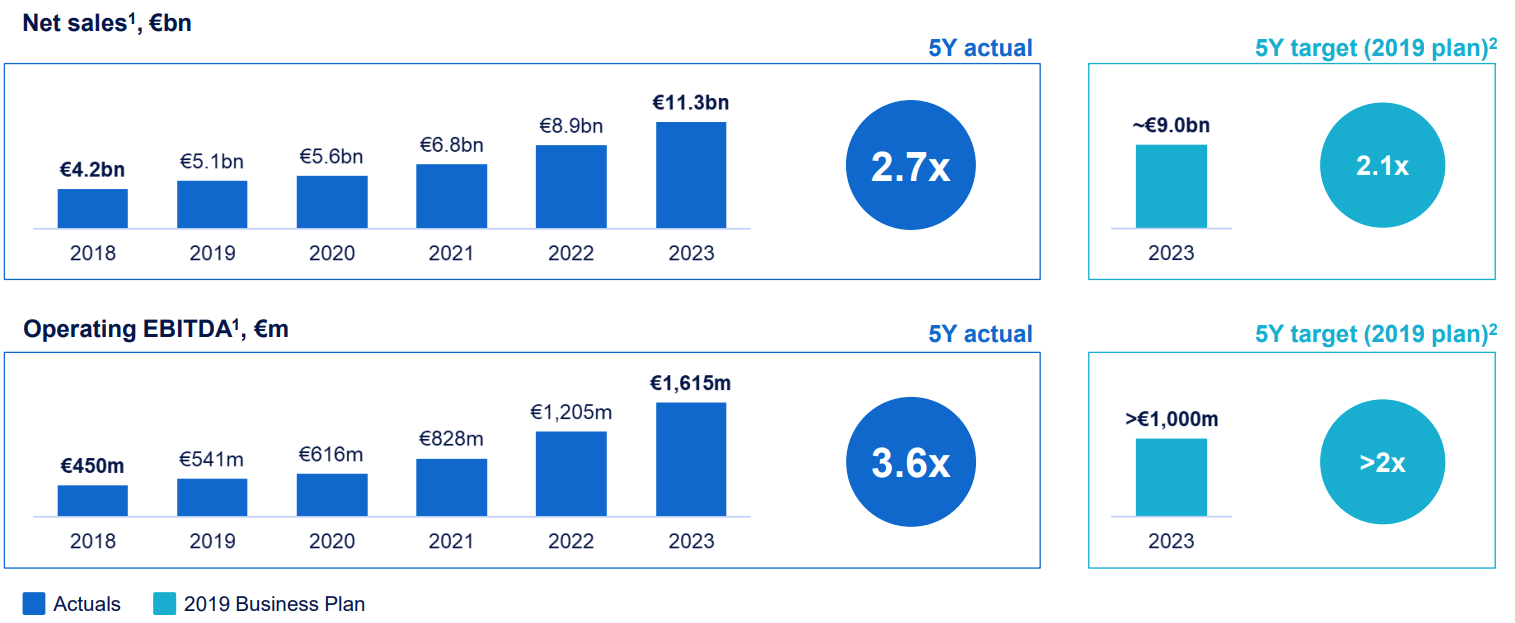
Chapter 5 | Overview + Other Investments
5.1 | Overview
Action, comprising 70% of 3i Group’s investment portfolio value, together with 3i Infrastructure (3%) and Scandlines (2%), accounts for 75% of the total value of 3i Group’s investment portfolio (see Chapters 3 and 4).
This chapter briefly addresses the remaining investments held by 3i Group. In addition to its stakes in Action, 3i Infrastructure, and Scandlines, 35 other investments contribute 25% to the total investment portfolio of 3i Group.
Below is a list of the top 20 investments held by 3i Group, including their respective value changes over the past three financial years. Following the table, five of these investments are discussed in further detail.
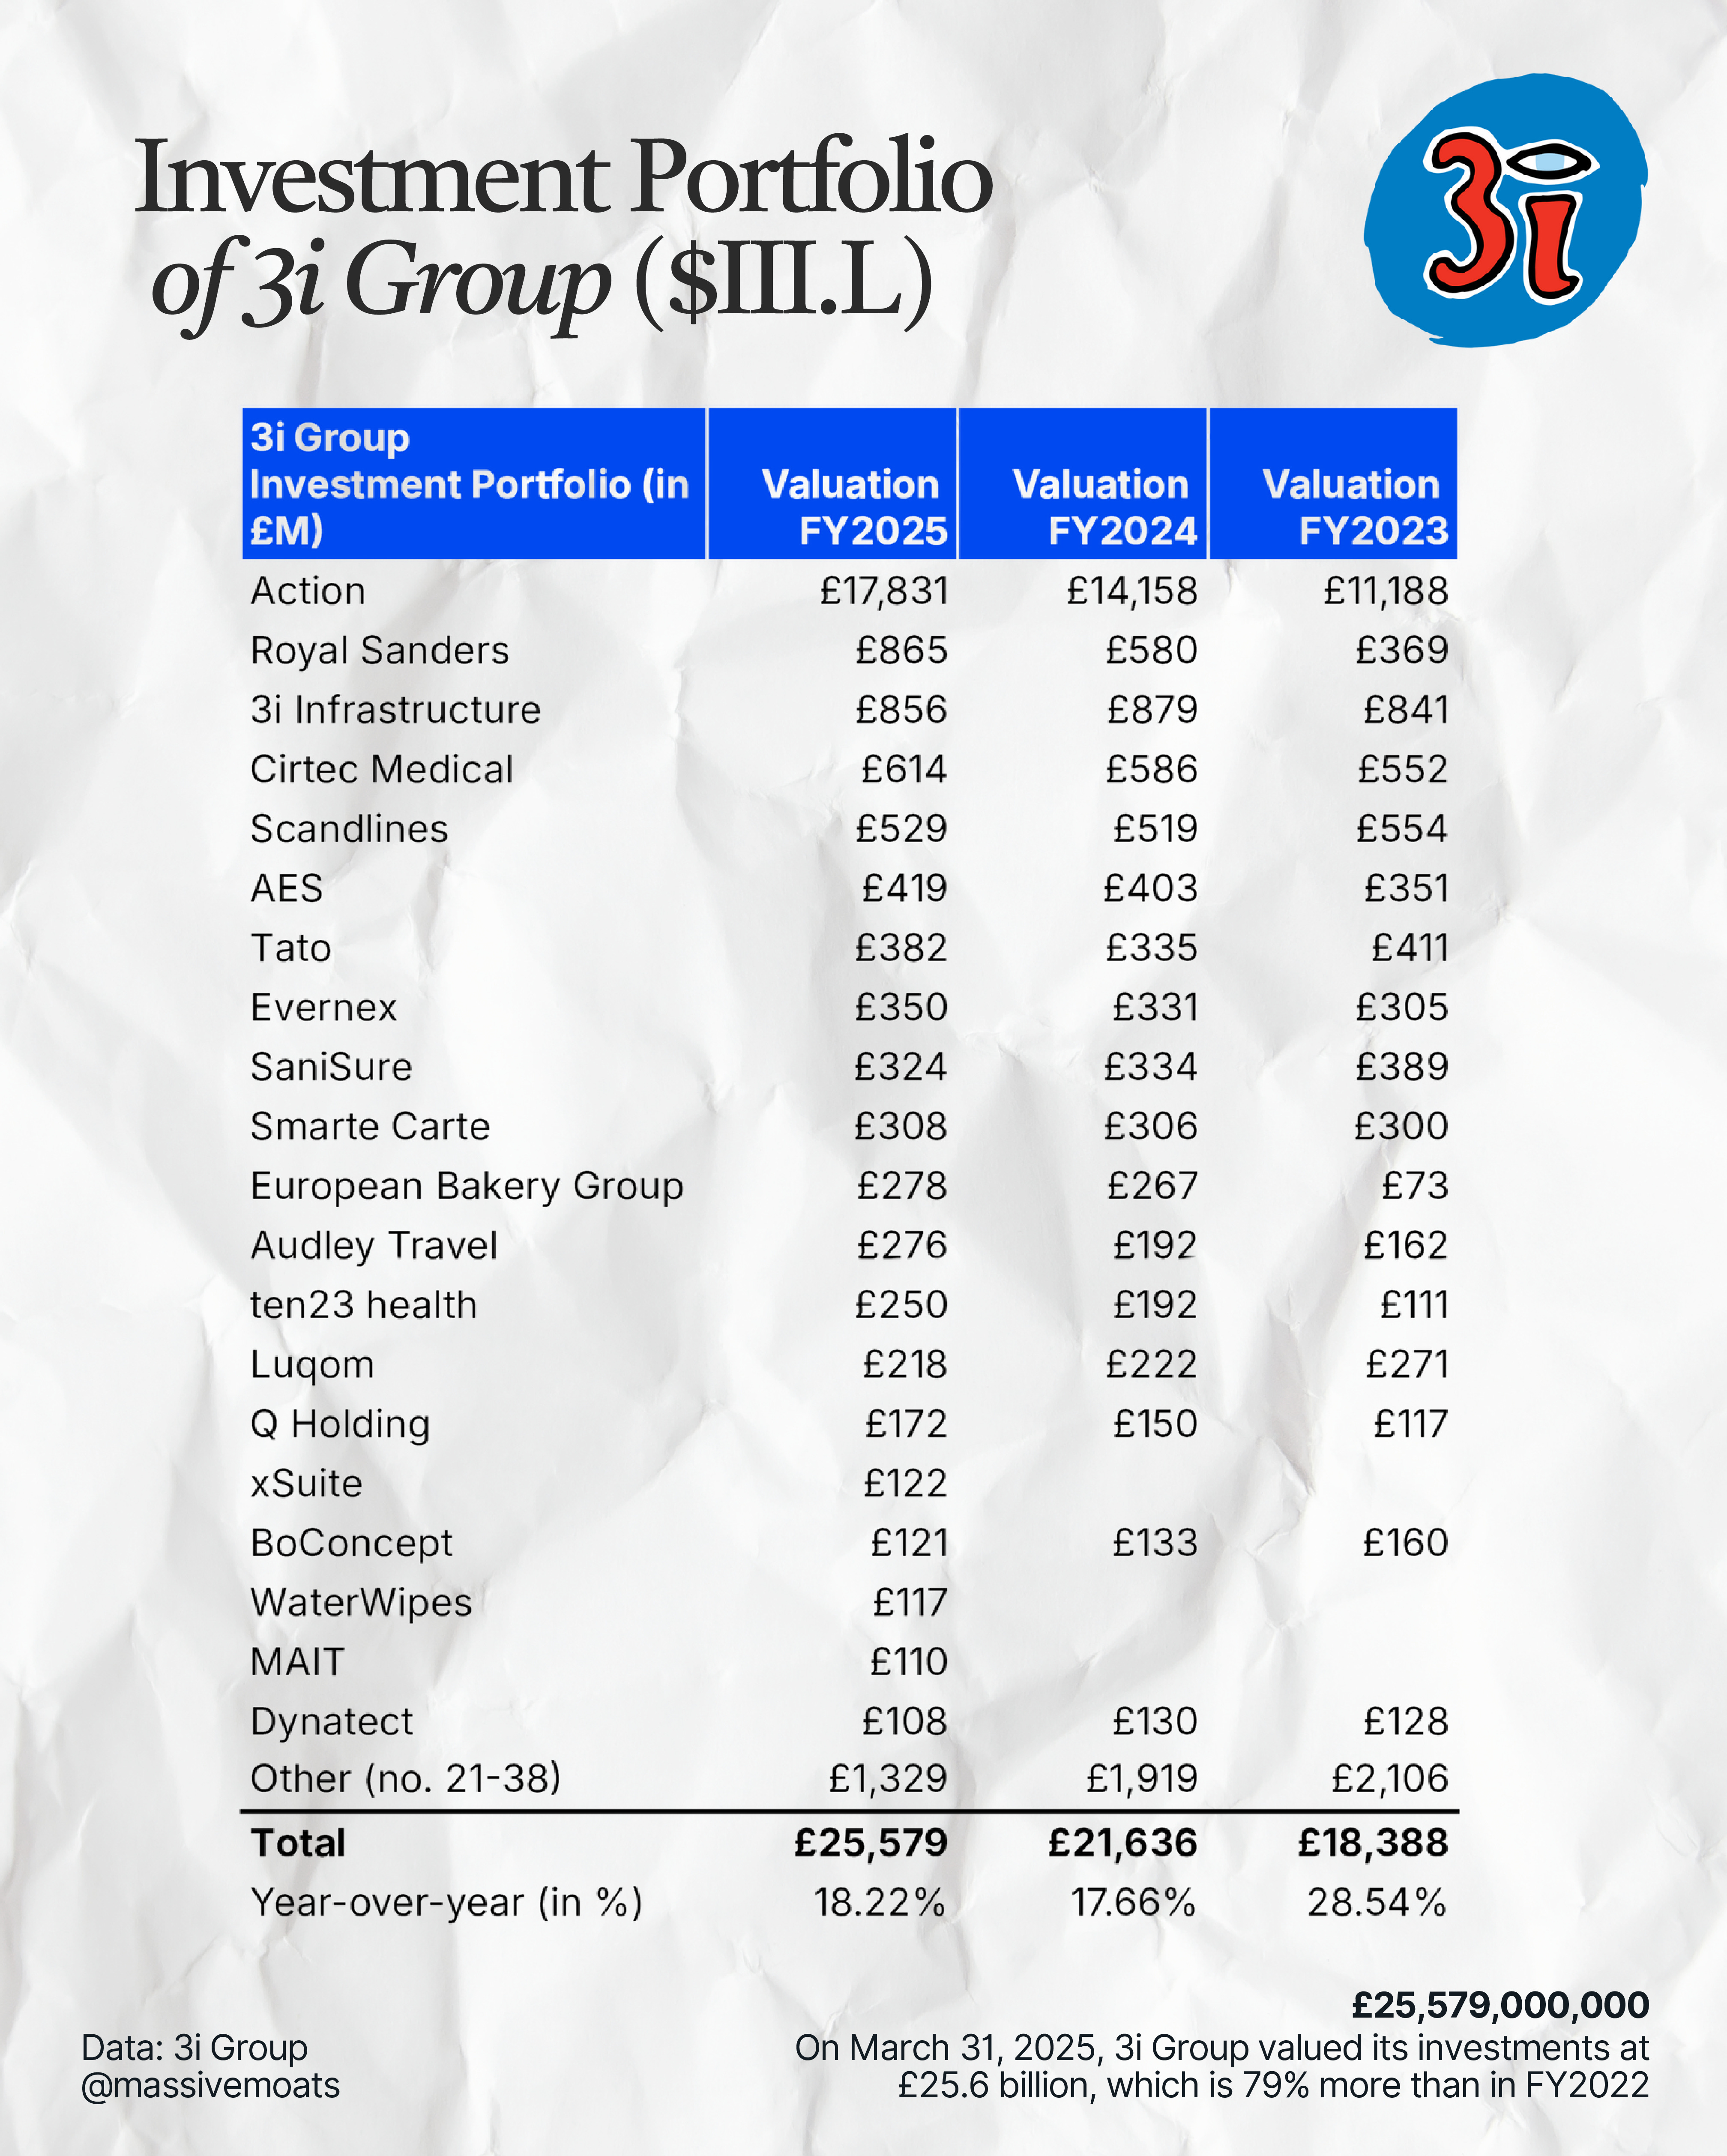
5.2 | Royal Sanders (£865 million)
Royal Sanders, a manufacturer of private label and contract-based personal care products, serves key markets including the Benelux, Germany, France, and the United Kingdom. The company operates production facilities in the Netherlands (Vlijmen and Zeewolde), the United Kingdom (Preston), Belgium (Ieper), and Germany (Groß-Rohrheim, Waiblingen, and Lübtheen) (Royal Sanders, 2025).
We are delighted to be partnering with 3i. It has extensive experience in buy-and-build in private label, for example through its investment in European soft drinks bottler Refresco, and in growing companies internationally through its network of valuable industry experts in the consumer sector. — Bart Hullegie, CEO, Royal Sanders
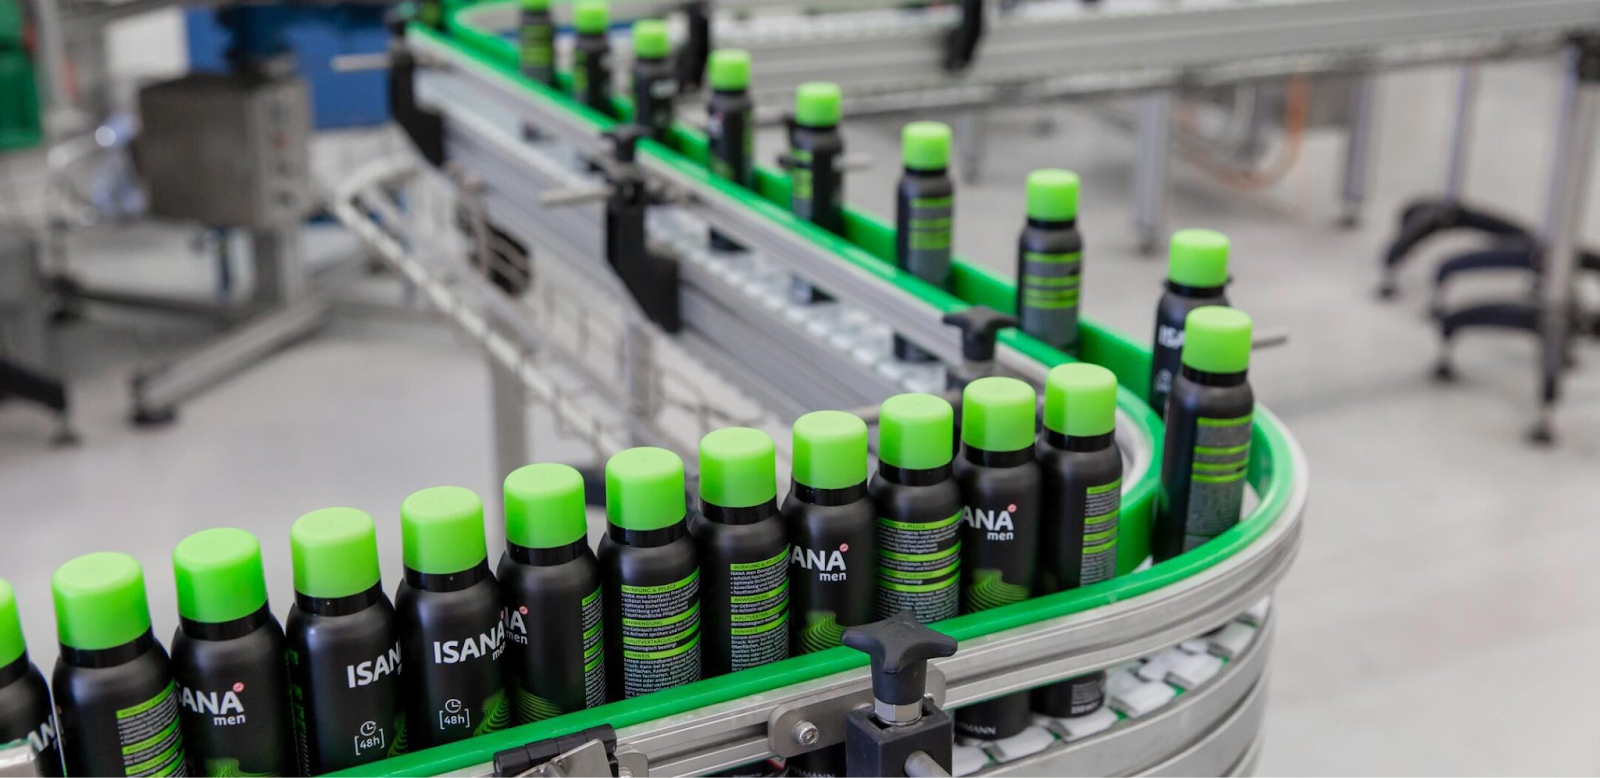
Its product portfolio includes items such as shampoo, bath and shower gel, body lotion, and hand soap. In addition to supplying third parties through private label and contract manufacturing, Royal Sanders owns the brands Van Gils, Sanicur, and Odorex.
Since 2018, the company has completed eight add-on acquisitions (3i Group, 2025), including the acquisition of Karium in June 2024, a business comprising eight cosmetic brands with a portfolio of 155 products (Karium, 2025).
5.3 | Cirtec Medical (£614 million)
Cirtec Medical represents the fourth-largest position in 3i Group’s portfolio, with an assigned valuation of £614 million (FY2024: £586 million), accounting for 2.4% of 3i Group’s total portfolio value. Cirtec Medical is a global provider of outsourced design, development, and manufacturing services for medical devices and components, specializing in Class II and III cardiac and neurological devices. Headquartered in Minnesota, United States, the company operates multiple production facilities across the United States, Germany, and Costa Rica (Cirtec Medical, 2025).
We look forward to partnering with 3i. We feel that their approach, sector understanding and international reach makes them the right partner to support the next stage of our growth. — Brian Highley, former CEO, Cirtec Medical
As of this moment, 3i Group holds its investment in Cirtec Medical for eight years, having initially invested approximately $136 million in the U.S.-based company in 2017 (3i Group, 2017). Since then, Cirtec Medical’s revenue has more than tripled, and the company has completed nine acquisitions, including Precision Components from Q Holding (3i Group, 2023, 2025).
5.4 | AES Engineering (£419 million)
AES Engineering, an investment of 3i Group since 1996, manufactures mechanical seals used globally in various pumps and rotating equipment to prevent the leakage of liquids and gases into the environment (3i Group, 2025).
The AESSEAL® range of seals, seal support systems, and bearing protectors are designed to improve reliability and reduce maintenance costs of rotating equipment (3i Group, 2025).
3i Group’s initial investment in AES Engineering was made in 1996 and expanded in 2007. As of March 31, 2025, 3i Group holds a 43% stake in the company (3i Group, 2025).
In August 2024, AES Engineering acquired Condition Monitoring Services (CMS), a company headquartered in Las Vegas, focused on the U.S. states of California, Nevada, Arizona, Utah, and Colorado. CMS specializes in the energy generation and municipal sectors, recognized as a leader in reliability and vibration monitoring, providing solutions for the prevention and resolution of issues related to machinery, foundations, and structures (3i Group, 2025).
Through strategic acquisitions like CMS, 3i Group continues to drive further growth for AES Engineering.

5.5 | European Bakery Group (£278 million)
European Bakery Group specializes in the production of bake-off bread and snack products. In 2021, 3i Group invested in Dutch Bakery, based in Brabant. In February 2023, Dutch Bakery acquired Trade Factory in IJmuiden, a company specialised in bapao, advancing 3i Group’s buy-and-build strategy in this sector.
In May 2023, European Bakery Group was established. Since 3i Group’s investment in 2021, the bakery holding company has completed four add-on acquisitions.

Regarding the performance of European Bakery Group, 3i Group stated the following in its FY2025 annual report:
European Bakery Group [with its three platforms Dutch Bakery,
coolback, Panelto] maintained resilient performance during the year, despite persistent pressures on input pricing and wage inflation. Following robust cash generation, EBG returned £22 million to 3i within 12 months of its additional investment in support of the acquisition of coolback in 2023. — 3i Group (2025)
As of 2025, 3i Group holds a 49% stake in European Bakery Group B.V. (3i Group, 2025, p. 199).
5.5 | Constellation (c.£100 million)
In May 2024, 3i Group announced a ~€116 million investment in Constellation, welcoming the French company as a new addition to its investment portfolio (3i Group, 2024).
Headquartered in Saint-Cloud, Constellation supports approximately 600 mid-sized and large enterprises in managing their IT infrastructure (Constellation, 2025). The company enables secure outsourcing of IT infrastructure management across various environments, including public cloud, private cloud, and on-premise (3i Group, 2025).
Constellation serves as a single point of contact, offering a comprehensive suite of hybrid cloud and managed cybersecurity services, underpinned by 2-3 year contracts and a strong emphasis on customer loyalty.
Prior to 3i Group’s investment, Constellation had completed 19 acquisitions since 2016, demonstrating its expertise in creating value through a buy-and-build strategy (3i Group, 2024). In FY2025, Constellation further expanded its portfolio with the acquisitions of ILKI, Feelserv, and Armonie (3i Group, 2025).
Through its investment in Constellation, 3i Group strengthens its position in the services and software sector.

Chapter 6 | Management
6.1 | Board of Directors & Executive Committee
In section 4.8, the management of Action was outlined. In this chapter, we dive into the management of 3i Group.

The Board of Directors of 3i Group comprises the following members:
Simon Borrows, Chief Executive Officer (CEO) since May 2012. Borrows joined 3i Group as Chief Investment Officer (CIO) in October 2011. Prior to 3i Group, he served as Chairman of Greenhill & Co International LLP and, before establishing its European operations, was Managing Director at Baring Brothers International Limited.
James Hatchley, Group Finance Director (CFO) since May 2022. Hatchley joined 3i Group in 2017 as Strategy Director. Previously, he was Chief Operating Officer (COO) at KKR in Europe and co-CEO of Avoca Capital. Earlier in his career, Hatchley spent 20 years in corporate finance, holding various roles at Freeman & Co., Greenhill & Co., and Schroders.
Jasi Halai, Chief Operating Officer (COO) since May 2022. Halai joined 3i Group in 2005, later serving as Group Financial Controller and Operating Officer. Prior to 3i Group, she worked at CDC Group (now British International Investment) and Actis.
David Hutchison, Chairman of the Board since November 2021 and Non-Executive Director since November 2013. Previously, Hutchison held roles as Director at Social Finance Limited, Head of UK Investment Banking at Dresdner Kleinwort Limited, and was a member of the Global Banking Operating Committee. From 2012 to 2017, he served as a Non-Executive Director of the Start-Up Loans Company.
The Board also includes six additional Non-Executive Directors: Stephen Daintith, Lesley Knox, Peter McKellar, Coline McConville, Hemant Patel and Alexandra Schaapveld.
In addition to the Board of Directors, 3i Group maintains an Executive Committee, comprising senior management from 3i Group and 3i Infrastructure. Alongside Simon Borrows (CEO), James Hatchley (CFO), and Jasi Halai (COO), the Executive Committee includes the following six members (3i Group, 2025):
Rob Collins, Managing Partner, Head of North American Infrastructure.
Kevin Dunn, General Counsel and Company Secretary.
Tony Lissaman, Partner & Chief Operating Officer Private Equity.
Julien Marie, Chief Human Resources Officer.
Bernardo Sottomayor, Managing Partner, Head of European Infrastructure.
Peter Wirtz, Head, Private Equity, Senior Partner.
Members of the Executive Committee often hold non-executive director positions on the boards of 3i Group’s portfolio companies. In these roles, they oversee operations, serve as strategic advisors, and perform governance and oversight functions.
6.2 | Skin in the Game
"Skin in the Game" refers to the extent to which management members hold an economic interest in the company they work for. This financial stake can create a form of extrinsic motivation, as strong company performance benefits these individuals through an increase in the value of their holdings.
3i Group mandates that its CEO maintain a minimum shareholding equivalent to 3.0x their gross salary after a build-up period. For the Group Finance Director and Chief Operating Officer, this requirement is 2.0x their gross salary. Other Executive Committee members are subject to a threshold of 1.5x their gross salary, while partners are required to hold 1.0x. Since 2018, non-executive directors on the Board of Directors are required to hold a minimum of 1.0x their annual remuneration (cash and shares) (3i Group, 2025, p. 144).
The table below details the current skin in the game for 3i Group’s Board of Directors as of March 31, 2025.
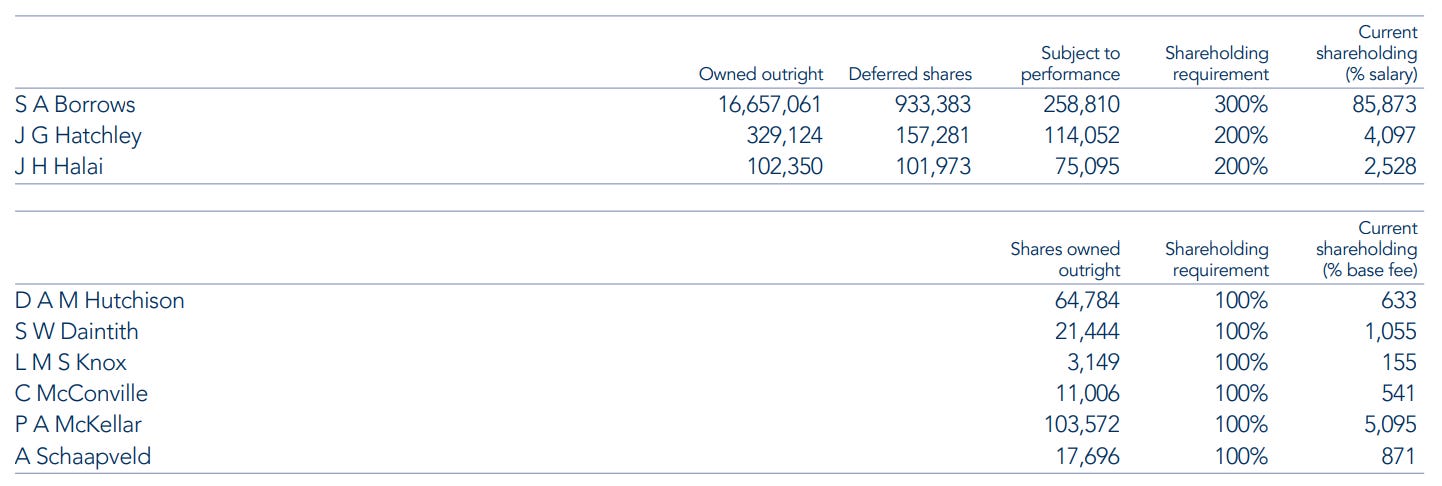
CEO Simon Borrows currently holds over 16.6 million shares, with an additional 933,000 shares pending, of which 258,000 are performance-based (see below). This equates to approximately 858x his gross annual salary.
The CFO and COO also hold significant stakes, well exceeding their respective 2.0x thresholds, by respectively 40x and 25x their annual gross salaries.
In addition to intrinsic motivation, share ownership provides management members with an additional extrinsic incentive. It also aligns their objectives with those of external shareholders, focusing on creating long-term shareholder value while considering the interests of other stakeholders in 3i Group’s operations.
6.3 | Compensation
According to the FY2025 annual report (3i Group, 2025), Simon Borrows (CEO), James Hatchley (CFO), and Jasi Halai (COO) receive variable bonuses in addition to their fixed salaries, benefits, and pensions. These bonuses consist of two components:
Annual Bonuses; and
Long-Term Incentive Plan (LTIP).
The Annual Bonus is distributed with 60% paid in 3i Group shares, which vest over a four-year period in four equal annual installments. The remaining 40% is paid immediately in cash.
The Long-Term Incentive Plan (LTIP) is designed to align with long-term objectives and comprises two equally weighted components:
Total Shareholder Return (TSR); and
Relative TSR compared to the FTSE 350.
(The FTSE 350 Index is a market capitalization-weighted stock index comprising the constituents of the FTSE 100 and FTSE 250 indices, representing the 350 largest companies by market capitalization listed on the London Stock Exchange.)
An overview of the current status is provided below.
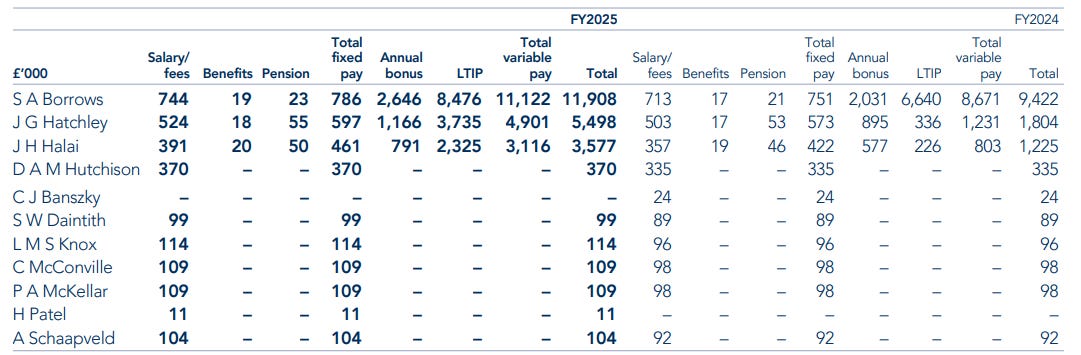
6.4 | Engagement
The Board of Directors (BoD) convenes seven regular meetings annually. In FY2025, all BoD members attended these meetings, with Mr. Patel joining the Board in February 2025.
In addition to these seven regular meetings, the BoD holds two off-site meetings outside the United Kingdom, including one in the Netherlands. In January 2025, the BoD visited the headquarters Action and one of its stores during the meeting in Amsterdam/Zwaagdijk-Oost. During this session, they received presentations from the CEO of European Bakery Group, Raoul Vorage, and the Private Equity team for Royal Sanders. In March 2025, a meeting was held at 3i Group’s office in Frankfurt, featuring presentations from the CEOs of OMS, Micha Erz, and LUQOM GROUP, Vanessa Stützle (3i Group, 2025).
Case study: LUQOM GROUP
LUQOM GROUP is an online platform specializing in lighting and smart home innovations, connecting over 500 suppliers with B2C and B2B customers across 29 countries through its webshops. In addition, the company also operates in-house private label brands. LUQOM GROUP has built a portfolio of over 50,000 products (LUQOM GROUP, 2025).
The above photo was shared by LUQOM GROUP’s CEO, Vanessa Stützle, on LinkedIn in December 2024, accompanied by the following text (Vanessa Stützle, 2024):
Over the course of two days it took more than 50.000 parcels, more than 600 involved people and an impressive amount of family pizzas to make Luqom’s BlackFriday rush 2024 a roaring success. I'm incredibly proud of the people in our team who made that happen. — Vanessa Stützle (2024)
On its website, LUQOM GROUP’s states that 3i Group serves as an investor in the company:
3i is an international investment company with two complementary business areas: Private Equity and Infrastructure. As an active partner, 3i supports its portfolio companies not only financially, but also with specialist sector and value creation knowledge as well as management expertise to maximize the potential of its portfolio companies. — LUQOM GROUP (2025)
As of March 31, 2025, 3i Group’s investment in LUQOM GROUP is valued at £218 million (3i Group, 2025), down from £448 million in FY2022. In its 2023 Annual Report, 3i Group adjusted the valuation of this investment downward due to reduced demand and weaker consumer confidence (3i Group, 2023). The 2024 Annual Report noted that the company faced challenges in 2023 from lower consumer spending linked to overstocking. In its most recent report, 3i Group stated the following:
Luqom continues to make an encouraging recovery and gained market share in 2024. The business saw top-line growth across all of its regions with particularly impressive performance from Southern and Eastern Europe, supported by nine new local webshops. — 3i Group (2025)
The valuation of 3i Group’s stake in LUQOM GROUP decreased year-over-year by €4 million in FY2025 to £218 million (FY2024: £222 million).
LUQOM GROUP’s websites range from value-based to premium design, positioning the company as the ‘Home of Lighting’ (LUQOM GROUP, 2025). With 27 webshops, LUQOM has established a presence in various niche segments, employing tailored pricing strategies.
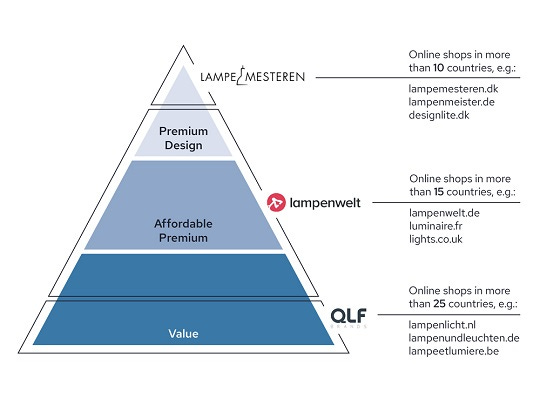
Chapter 7 | Risks
In its 2025 Annual Report, 3i Group outlines the risks it anticipates and details its risk management approach, starting from page 82.
Effective risk management underpins the successful delivery of our strategy and longer-term sustainability of the business. Our values and culture are integral to our approach to risk management. — 3i Group (2025)
In its risk management, 3i Group makes a distinction between investment risk and capital management.
7.1 | Investment Risk
3i Group has established frameworks to mitigate investment risk — defined as risks associated with selecting new portfolio companies. The following criteria guide its approach:
Money Multiple Target: New investments must achieve a projected money multiple factor of at least 2.0x over a 4-to-6-year period.
Geographic Focus: Target companies must be headquartered in 3i Group’s core markets of Europe or North America.
Sector Expertise: 3i Group focuses on sectors where it has deep expertise, namely Consumer & Private Label, Healthcare, Industrial, and/or Services and Software.
The majority of 3i Group’s invested capital is allocated to its long-term hold portfolio, primarily comprising its Private Equity holdings in Action and Royal Sanders. These companies exhibit strong compounding characteristics and are cash generative. 3i Group targets a 15% return hurdle for these investments.
For 3i Infrastructure, the overarching objective is to achieve a compound annual growth rate (CAGR) of 8%-10% over the medium term, with new investments aligned to this target. Other infrastructure investments are expected to deliver an implied gross return of approximately 15%.
3i Group emphasizes flexibility in the time horizon for its investments.
[...] the Group may conclude that it is in the interest of shareholders, and consistent with our strategic objectives to hold an investment for a longer period of time. — 3i Group (2025)
A ‘longer period’ refers to either a duration exceeding the average (expected) holding period [of that of 3i Group or private equity companies in general] or one that remains undefined. This is exemplified by its stakes in Action and Royal Sanders, which have, in the past years, increasingly been positioned as long-term holdings. This commitment is visible by 3i Group’s ongoing reinvestments in these companies to increase its exposure.
7.2 | Capital Management
3i Group adopts a conservative approach in managing its capital resources, aiming to maintain financial stability through the following measures:
Liquidity Management: The company targets a liquidity between a net debt position of c.5% and a net cash position of c.2.5% as a percentage of its NAV. It allows for short-term flexibility to operate with up to 15% gearing. However, 3i Group explicitly states it has no intention of maintaining structural leverage on its balance sheet.
Currency Risk Management: While accepting a degree of currency risk, 3i Group mitigates its impact through a hedging program, which in FY2025 was valued at €2.0 billion and $1.2 billion.
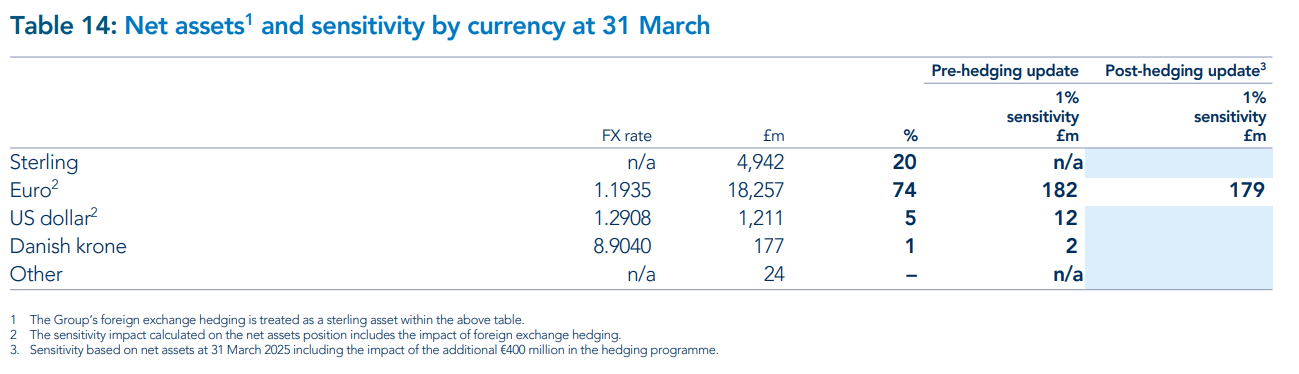
In my assessment, 3i Group’s risk management framework is robust and effectively mitigates the primary risks inherent in private equity investing.
Additionally, economic and geopolitical risks, which are intrinsic to investing in operating companies internationally, are addressed in detail starting on page 87 of AR2025. In my view, the 3i Group’s approach to these risks is also adequate.
7.3 | Risks Related to Action
In addition to traditional risks at the management, operational, and logistical levels, Action faces primary exposure to future risks stemming from competition and changing consumer behavior.
In Section 4.6, I provided an overview of Action’s competitors and peers, drawing lessons from the bankruptcies of former Dutch competitors Big Bazar and Blokker. These companies failed to anticipate changes in consumer behavior, which competitors like Kruidvat and NORMAL have successfully addressed. Both Kruidvat and NORMAL pursue strategies similar to Action, offering affordably priced, surprising assortments. Kruidvat emphasizes a promotion-driven pricing strategy, while NORMAL, like Action, focuses on consistently low prices without reliance on structural promotions.
Concepts like Kruidvat and Action can coexist effectively. Similar models likely exist internationally, but I do not view this as a significant threat to Action. Beyond shared product categories, Action offers a broader range of products at low, fixed prices, differentiating itself from competitors.
In the analysis of Action’s competitors, I also examined other European players, such as Denmark’s NORMAL. NORMAL’s ongoing growth demonstrates the appeal of its concept, positioning it as a closer peer to Action than, for example, former Dutch concept Big Bazar. NORMAL primarily focuses on personal care, makeup, and snacks & drinks, resembling Kruidvat to some extent. However, its pricing strategy aligns with Action’s low-price model rather than Kruidvat’s promotion-driven approach. As noted, Action’s more diverse product assortment sets it apart from both Kruidvat and NORMAL. I believe a trendier NORMAL, with its strong social media strategy, poses a greater competitive threat to chains like Kruidvat and Trekpleister than to Action, though NORMAL’s development warrants monitoring. The discount retail sector retains sufficient growth potential for multiple players employing low-price strategies without relying on promotions.
In addition, there is Pepco, which has already expanded across a significant part of Europe and therefore operates in many of the same markets as Action. However, I assess the competitive threat posed by Pepco to Action as low. While Pepco shares some product categories, its focus on clothing aligns more closely with a concept like HEMA. In the Netherlands, HEMA has survived the past decade, unlike Blokker and Big Bazar, and coexists successfully with Action. I anticipate minimal competitive pressure between Pepco and Action as both continue to grow. This is evidenced by Pepco’s strong presence in Poland, with 1,339 stores, where Action entered in 2017—well after Pepco—and has since grown to become its fourth-largest market by store count (387 as of December 31, 2024). This suggests Action can expand and thrive in markets where Pepco is already established.
The Dealz concept, operated by Pepco Group, plans to expand into Central and Eastern Europe following its presence in Poland. Unlike Action’s focus on consistently low prices, Dealz incorporates promotions. Dealz has exited France, Spain, Ireland, and the UK, with former Dealz stores converted to Pepco outlets. Despite overlapping product categories, I assess Dealz’s competitive threat to Action as low, given its limited presence in Europe and Pepco Group’s consideration of divesting Dealz alongside Poundland.
TEDi, a German discount chain, primarily offers white-label and select private-label products, focusing on ultra-low-priced items (€1). I do not consider TEDi a direct competitor, as it lacks Action’s strong assortment of branded products and higher-priced private and white-label goods (above €1). Their overlapping product categories are limited, and their strategies diverge significantly.
Conclusion competition
I assess Action’s competitive position as strong. Its expanding European footprint enhances its resilience against potential competitive challenges. However, I believe such challenges are unlikely, given Action’s significant consumer surplus, with peers priced 58-95% higher than Action. Action places the customer first, fostering substantial goodwill across its markets. Increasing transaction volumes, as reported by Action (3i Group), indicate growing consumer preference for its stores.
Could an economic downturn reduce customer visits to Action? Possibly, although I find it more likely that consumers will visit Action stores more frequently, seeking savings—a trend observed during periods of high consumer price inflation in recent years, as Action reported strong like-for-like (LFL) growth during this period. In 2023, Action reflected:
The recent rise in the cost of living means consumers have become more price-conscious, shopping around for lower prices. Many have prioritised household goods like cleaning products. In response, we’ve kept tight control of costs, passing on our cost advantages where possible to customers, while our approach of introducing 150 new products weekly enables us to adapt to meet changing customer needs. — Action (2023)
Action’s cost-conscious approach is deeply embedded in its DNA, with a mission to maximize price surplus for consumers.
Reputational Risks
Action faces potential reputational risks from scandals, particularly given its reliance on production in regions in the Far East. Maintaining stringent quality controls is critical. Reputational damage could also arise from negative publicity related to sustainability, corporate social responsibility (CSR), or specific products. Additionally, growing consumer adoption of sustainability in Western markets—favoring fewer, more durable purchases—could impact Action.
While this trend is real, I assess its impact on Action as minimal. Action is increasingly integrating CSR and sustainable products into its assortment, reporting various CSR-related KPIs (Action, 2025):
Action, Sustainability
In 2024, we carried out social audits and spot checks at 95% of factories in at-risk countries.
100% of the timber used in our products* comes from sustainably managed forests, certified either by the Forest Stewardship Council (FSC) or the Programme for the Endorsement of Forest Certification (PEFC).
100% of the cotton we use in our products* is now sustainably sourced under the Better Cotton programme – either that, or it’s organic or recycled.
100% of the cocoa used in Action products* is certified as sustainable by Fairtrade International, or by other recognised standards.
100% of the palm oil we use as a primary ingredient in food & drink and candles is now certified as sustainable under the Roundtable for Sustainable Palm Oil (RSPO) or similar organisations. Our aim is to extend this to personal care products by the end of 2025.
100% of packaging used for private label products is recyclable, containing no PVC or hard-to-recycle black plastic.
While a discount retail concept inevitably maintains a certain environmental footprint, I believe it also plays a constructive role in giving residual goods within the supply chain a second life. Action, for instance, procures both non-food and food items that are either surplus stock or nearing their expiration date—products that might otherwise have been discarded.
One could argue that certain items in Action’s assortment are not the most sustainable choices (relative to more environmentally friendly alternatives), or that they cater to consumption that may be considered excessive in a Western context where overconsumption and waste are prevalent. However, in my view, the company’s overall societal contribution outweighs these negative aspects.
Moreover, I expect that structural trends such as those outlined above—should they begin to materialize—will unfold gradually. This would allow sufficient time for a critical reassessment of Action’s business model, should such an evaluation become necessary in the future.
Chapter 8 | Moat Analysis
To assess the moat of 3i Group, I focus primarily on Action, which currently accounts for approximately 70% of 3i Group’s investment portfolio.
Action is a buyer and seller of fast-moving consumer goods (FMCG), operating physical stores strategically located in cost-effective areas to distribute its low-priced products directly to consumers.
This is achieved without relying on proprietary intellectual property—although one could argue that the Action brand itself holds meaningful value, given its strong visibility on storefronts and its ability to attract customers. In addition, Action’s private label products resonate well with consumers, as evidenced by the number of awards these labels have won. However, this does not translate into significant pricing power. While the company is able to pass on increased input costs through modest price increases—thanks to the already substantial consumer surplus it offers—its pricing strength remains relative. Maintaining this surplus advantage over competitors, whose prices are on average 58–95% higher than Action's, is therefore key.
Action’s moat is fundamentally built on preserving this large consumer surplus through sustained low pricing, in combination with the companies’ element of surprise in its offerings. To ensure future success, the company must continue prioritizing low prices. This can be achieved by leveraging economies of scale and increasing buying power.
The term buying power is explicitly referenced in 3i Group’s annual reports (AR2024, p. 3; AR2023, p. 9). As Action grows—through expansion and like-for-like (LFL) sales growth—its bargaining position with suppliers (e.g., A-brands, including tailor-made, unique products) and manufacturers (both for private label and white label goods) strengthens. This growth also enhances the company’s operational scale advantages, reflected in its operating leverage.
Action’s competitive edge lies in optimizing marginal efficiencies, driven by a high inventory turnover rate. As the company scales, it can negotiate lower unit prices from suppliers. For example, a manufacturer may quote €0.80 per flowerpot for a 200,000-unit order, while offering €0.70 per unit for a 500,000-unit order. These flowerpots can then be distributed across Action’s growing store network. Although a €0.10 difference per unit may appear minor, it represents an additional 12.5% discount. Applied across 6,000 SKUs, this results in substantial annual savings.
Benefits derived from scale—whether in procurement costs, cost of goods sold, or lower headquarters/distribution expenses per store—can be reinvested into further price reductions. This not only raises the barrier to entry for new competitors, but also widens the consumer surplus relative to existing players. This creates a self-reinforcing cycle of growth and competitive advantage, assuming disciplined execution.
With a solid foundation in Europe and a favorable position relative to peers, I assess Action’s moat as strong.
3i Group
Action’s success is in no small part attributable to 3i Group, which has been instrumental in accelerating Action’s expansion and driving operational excellence since 2011. One could reasonably argue that 3i Group’s expertise continues to be a valuable asset for the company’s future value creation. While this analysis does not benchmark 3i Group against other investment firms, I consider the firm’s professionalism and domain expertise to be of a very high standard.
Chapter 9 | Valuation
This chapter presents my perspective on the valuation of 3i Group, divided into two sections:
Valuation of Action
Valuation of 3i Group (including other holdings)
9.1 | Valuation of Action
To derive a realistic valuation of Action, the following factors are essential:
Like-for-like (LFL) growth of stores;
Growth from further expansion;
Changes in profitability;
A multiple (/yield) applied to its annual free cash flows.
9.1.1 | Action Like-For-Like Growth
Over the past decade, Action has reported varying annual LFL growth rates. The COVID-19 pandemic and related government restrictions on store openings have led to significant fluctuations in Action’s LFL growth, complicating the establishment of a consistent baseline for comparison.
In the table below, Action’s reported LFL growth figures are presented, as initially published, alongside a normalized baseline. This normalized baseline was reported by Action/3i Group based on store-level data.

Below is a graph showing above figures; Action's LFL growth since 2015 (2020-2022 = normalized figures).

Since the average LFL growth rate of 8.3% over the past 10 years is subject to variations, driven by factors including non-company-specific circumstances, it is critical to analyze the underlying drivers of each annual growth rate to formulate realistic assumptions for future LFL growth projections. Below is an analysis of notable developments and circumstances impacting Action’s performance over the past decade.
2017 (5.3% LFL Growth)
For calendar year 2017, 3i Group provided the following commentary regarding Action’s 5.3% LFL growth, which was lower than in previous years (2015: 7.6%; 2016: 6.9%):
Growth on this scale is very challenging to manage and Action encountered its share of issues in logistics and distribution and within certain product categories in 2017. These challenges, together with building a pan-European infrastructure to cope with the medium-term ambition of €10 billion of revenues, will have a dampening effect on the rate of profit growth expected this year [2018], as they did in 2017. — Simon Borrows, 2018 (p. 9)
2018 (3.2% LFL Growth)
Over the 2018 calendar year, 3i Group provided the following commentary regarding Action’s 3.2% LFL growth.
These results were achieved despite a challenging year for the broader European retail industry and operational supply chain issues in France. — Simon Borrows, 2019 (p. 8)
Action recruited a new planning team and added further resource to its buying and supply chain teams. — Simon Borrows, 2019 (p. 8)
[...] It will also mitigate the effect of the DC performance and product availability issues that Action has experienced over the last 12 months, particularly in France. The DC expansion is being accompanied by the roll-out of new IT systems to support stock planning and DC organisation, in order to manage better the increasing complexity inherent in the end-to-end supply chain planning, given the rapid roll-out of Action stores and DCs across Europe. — Simon Borrows, 2019 (p. 8-9)
The supply chain improvements resulted in strong performance in France and elsewhere in the final months of 2018. LFL sales growth increased in the final quarter of 2018 to a healthy 4.4% overall, [...] , with higher and more stable stock availability seen across the French network of stores. Strong LFL sales growth has continued during the first four months of 2019. — Simon Borrows, 2019 (p. 9)
(Post-)COVID-19 (2020-2022)
The following outlines Action’s LFL growth for the years 2020–2022. For these years, Action has altered its growth figures for normalization. Action’s methodology for its normalized metrics is as follows:
For 2020 and 2021, adjustments were applied in countries where Action was required to close stores and/or for stores that remained open but operated with a limited product assortment.
Additionally, for 2020 and 2021, corrections were made for the first three weeks following store reopenings to account for abnormal trading patterns.
In 2022, the impact was minimal, with Action only required to close its stores in the Netherlands for the first two weeks. Consequently, no normalizations were applied to the 2022 data regarding store trading hours. However, adjustments were made to ensure a consistent comparison with 2021.
Adjustments have also been made to account for consumer catch-up demand, though the precise methodology for these adjustments remains unclear to me.
Below, a detailed commentary per (post-)COVID-19 year is provided.
2020 (10.4% LFL Growth, Normalized)
For the 2020 calendar year, 3i Group provided the following commentary regarding Action’s 10.4% LFL growth:
In the first 11 weeks of 2020, Action recorded very strong performance with LFL sales growth of over 7%. Late in March 2020, as the outbreak of COVID-19 intensified across Europe, Action faced government- enforced temporary closures of all of its stores in France, Belgium and Austria and partial closure of stores in Germany and Poland. — Simon Borrows, 2021 (p. 9)
2021 (7.5% LFL Growth, Normalized)
In the 2022 Capital Markets Day presentation, the normalization methodology for 2021 was discussed, applying the same approach as outlined in the 2023 CMD.
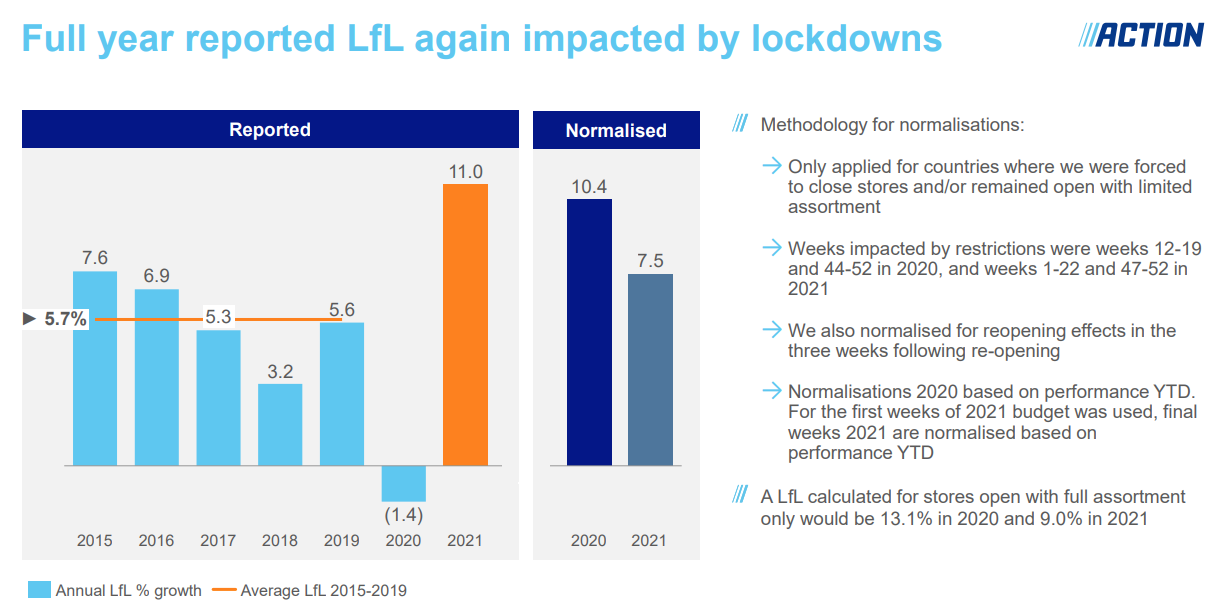
As a result, Action’s normalized LFL growth for FY2021 was approximately 290 basis points lower, resulting in 7.5% year-over-year growth.
2022 (9.7% LFL Growth, Normalized)
For the 2022 calendar year, 3i Group provided the following commentary regarding Action’s unnormalized LFL growth of 18.1%:
[...] LFL sales growth of 18.1% driven by higher footfall and a higher number of transactions. The removal of the remaining limited Covid-19 restrictions in the first quarter of 2022 also contributed to this performance. Sales grew across all of Action’s 14 product categories, with particularly good sales of daily essential products. — Simon Borrows, 2023 (p. 9)
Notably, in 3i Group’s 2022 annual report, which typically includes commentary on Action’s prior fiscal year (i.e., 2021), a remark was made regarding Action’s Q1 2022 performance, reporting an LFL growth of 28%. This was normalized to -0.7% in the figure included earlier, with FY2022 normalized LFL growth reported at 9.7%.
2023 (16.7% LFL Growth)
For the 2023 calendar year, 3i Group provided the following commentary regarding Action’s 16.7% LFL growth (from 2023 onward, Action no longer applies normalization):
[...] LFL sales growth of 16.7%, mainly as result of an increase in footfall and transaction volumes. — Simon Borrows, 2024 (p. 9)
No normalization was applied to FY2023. The 2024 CMD presentation included the following figure (p. 40):
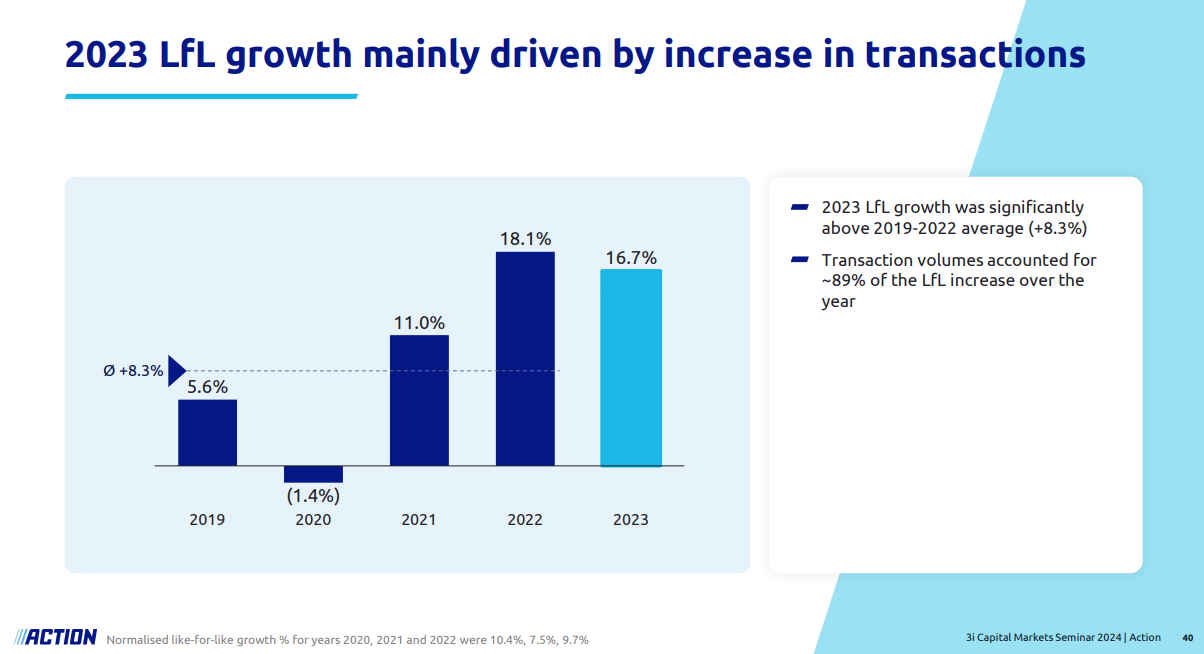
It is reasonable to assume that the 16.7% LFL growth reported for 2023 represents the year-over-year growth rate compared to the unnormalized figures for 2022. 3i Group noted that approximately 89% of the 2023 LFL growth was driven by higher transaction volumes.
Additionally, 3i Group highlighted that Action reduced the prices of 2,500 products in 2023:
Its low price points are fundamental to its offering and, in 2023, it continued to invest in its strong customer proposition by reducing 2,500 prices across its product assortment. 67% of its products are priced under €2. — 3i Group, 2024 (p. 24)
In conclusion, 2023 is recorded as an exceptionally strong year for Action.
2024 (10.3% LFL Growth)
2024 also demonstrated robust performance with 10.3% LFL growth. The following characteristics can be distilled from this:
Q1-2024: “Primarily driven by increased transaction volumes” (3i Group, 2024).
Q2-2024: “Driven by a combination of high transaction volumes, outperformance in everyday necessities, and a negative price effect” (3i Group, 2024).
September 2024: “LFL sales growth was driven by customer transactions and strong sales of everyday necessities” (3i Group, 2024).
Q3-2024: “Following 4,000 price reductions in 2023 and 2024, Action’s sales growth was driven by a higher number of customers” (Action, 2024).
FY2024: “Transaction volumes accounted for 102% of the LFL sales growth over the year, as the business benefited from new customer acquisitions and more frequent visits from existing customers” (3i Group, 2025).
Conclusion
I believe the normalization methodology applied by Action during the COVID-19 years to adjust for stores that remained closed, or operated with a limited assortment, is clear and understandable. However, the normalization for the catch-up effect, as applied in 2022, is more challenging to interpret.
To gain further insight, I conducted my own calculations and mapped out the trajectory of Action’s estimated per-store revenue growth over the years. The chart below illustrates the following:
[in pink] The LFL year-over-year growth as reported by Action/3i Group, incorporating the normalized growth percentages reported for the COVID-19 years (2020–2022).
[in blue] The year-over-year growth in estimated average revenue per store. This average revenue per store figure is calculated by dividing the annual revenue of Action in a year by the average number of stores for that year (the denominator is derived by averaging the number of stores at the beginning and end of the year).

For the years 2015–2019, Action’s reported LFL growth was approximately 4% higher than the calculated revenue growth per store. This discrepancy is logical, as newly opened stores do not contribute full-year revenue in their first year, and the majority of new store openings may be weighted toward the end of the year.
For the years 2020–2023, the analysis reveals the following:
2020: Action continued to expand its store network in FY2020, albeit at a slower pace than in prior years (164 new stores in 2020 compared to an average of 224 per year from 2016–2019).
2021: The normalized LFL growth in 2021 closely aligns with the calculated year-over-year revenue growth per store. With 267 new stores opened in 2021, this suggests a relatively conservative normalization approach by Action for that year.
2022: The normalized LFL growth (9.7%) is lower than the actual calculated revenue growth per store. Considering the opening of 280 new stores in 2022, this indicates a potentially overly conservative normalization of the LFL metric (reported as 9.7% instead of 18.1%). It is possible that Action overweighted the estimated catch-up effect for this year, resulting in conservative normalized growth numbers reported.
2023: The reported LFL growth of 16.7% is approximately 4.3% higher than the calculated revenue growth per store (including the opening of 303 new stores). This suggests that the 16.7% LFL growth figure for 2023 is accurate.
With a reported LFL growth of 10.3% in 2024, Action continues to deliver above-average performance (the average LFL growth from 2015–2024 is 8.3%). This growth includes a negative price effect from 2,000 product price reductions in 2024. Consequently, the volume component of the LFL growth exceeds 10.3%, as confirmed by 3i Group: “Transaction volumes accounted for 102% of the LFL sales” (3i Group, 2025).
This brings us to the question: what is an appropriate LFL growth rate for the future?
Assessing Future Like-for-Like Growth
Regarding 2017 (5.3% LFL growth) and 2018 (3.2% LFL growth), 3i Group repeatedly cited logistical issues in France. In my assessment, the subdued LFL growth during these periods was primarily attributable to supply-side constraints rather than demand-side factors. Conversely, the years 2015 (7.6% LFL), 2016 (6.9% LFL), 2019 (5.6% LFL), and 2024 (9.8% year-to-date) offer a robust indication of the company's normalized LFL growth potential under typical operating conditions, excluding periods of logistical disruption, COVID-19 restrictions, or subsequent recovery and normalization effects.
Despite the variations observed, the preceding analysis suggests that Action's LFL normalization has been prudently applied, appearing more conservative than selectively alteration.
According to page 40 of the CMD 2024 presentation, approximately 89% of Action's 2023 LFL growth (16.7%) was driven by transaction volumes. This indicates an increase in the number of transactions, resulting from either higher customer frequency, new customer acquisition, or a combination thereof. In 2024, however, LFL growth registered lower at 10.3%, a figure that incorporates price reductions on 2,000 products. This follows a similar initiative in 2023, where prices were lowered on 2,500 products.
The average LFL growth for the years 2015, 2016, 2019, and 2024 is 7.6%. This is 0.7 percentage points lower than the average LFL growth recorded between 2015 and 2024.
I believe that 7.5% is a fair LFL growth to project going forward. While concluding this may seem conservative given the 16.7% growth in FY2023 and 10.3% in 2024 (both inclusive of price reductions, although other products may have seen price increases), it represents, in my view, a solid average growth figure—one that also leaves room for periods of lower growth.
For my valuation analysis, I will therefore assume a rate of 7.5% CAGR for the LFL growth through 2035, predicated on normalized market conditions, including a baseline level of inflation.
9.1.2 | Growth from Expansion
The accompanying chart illustrates Action's net annual increase in store count.

The significant ramp-up in Action's expansion strategy following 2012 is clearly evident in the chart above, coinciding with 3i Group's strategic oversight.
Earlier in 2024, Action initially communicated a target of opening 330 new stores during the year. This guidance was subsequently revised upwards to 350 stores during the publication of 3i Group's H1 2025 results and Action's Q3 2024 update, representing an increase of 20 stores from the prior communication.
As of September 30, 2024, Action had already opened 189 new stores year-to-date. This implies that an additional 163 stores (352 - 189) were projected to open in Q4 2024. Despite the ambitious nature of this target, CEO Hajir Hajji expressed confidence in its achievement, stating:
During the remainder of 2024, we plan to open a significant number of new stores, including three weeks with more than twenty new store openings in a single week. I am proud of the tremendous engagement of our colleagues. This enables us to do better every day. — Hajir Hajji, CEO, Action (Action, 2024)
In 2024, Action ultimately opened a total of 352 stores. This brings the average annual store openings for the period since 2016 to c.250 stores, a figure that includes the lower volume of 164 openings during the COVID-19 impacted year of 2020. During CMD 2023, 3i Group indicated Action's strategic intent to open 1,300-1,400 new stores over a four-year period, translating to an average of 325-350 stores annually. This outlook was re-affirmed at CMD 2024.
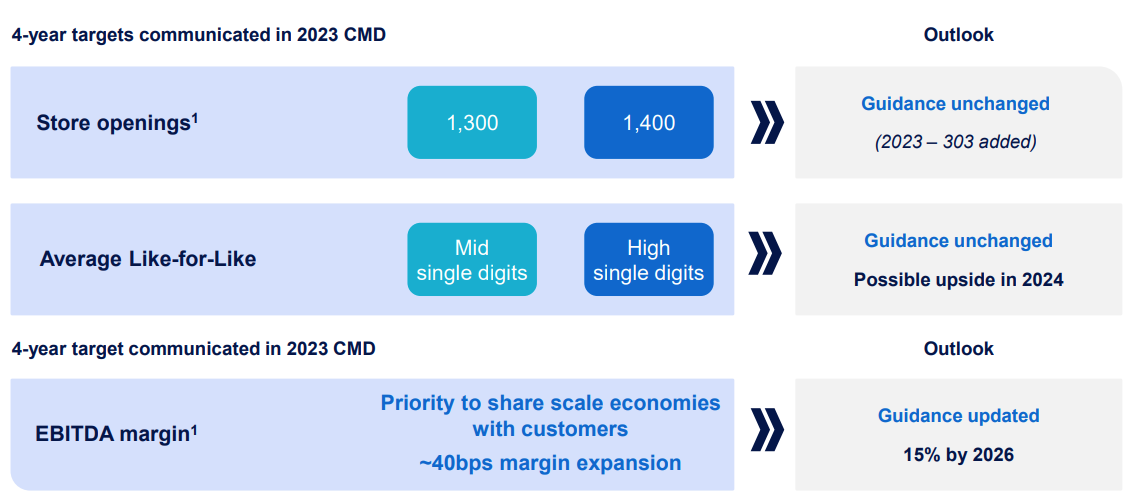
According to 3i Group's recent Action Capital Markets Day (CMD 2025), the estimated additional white space potential for Action, across existing and identified in-scope countries, stands at 4,850 stores.
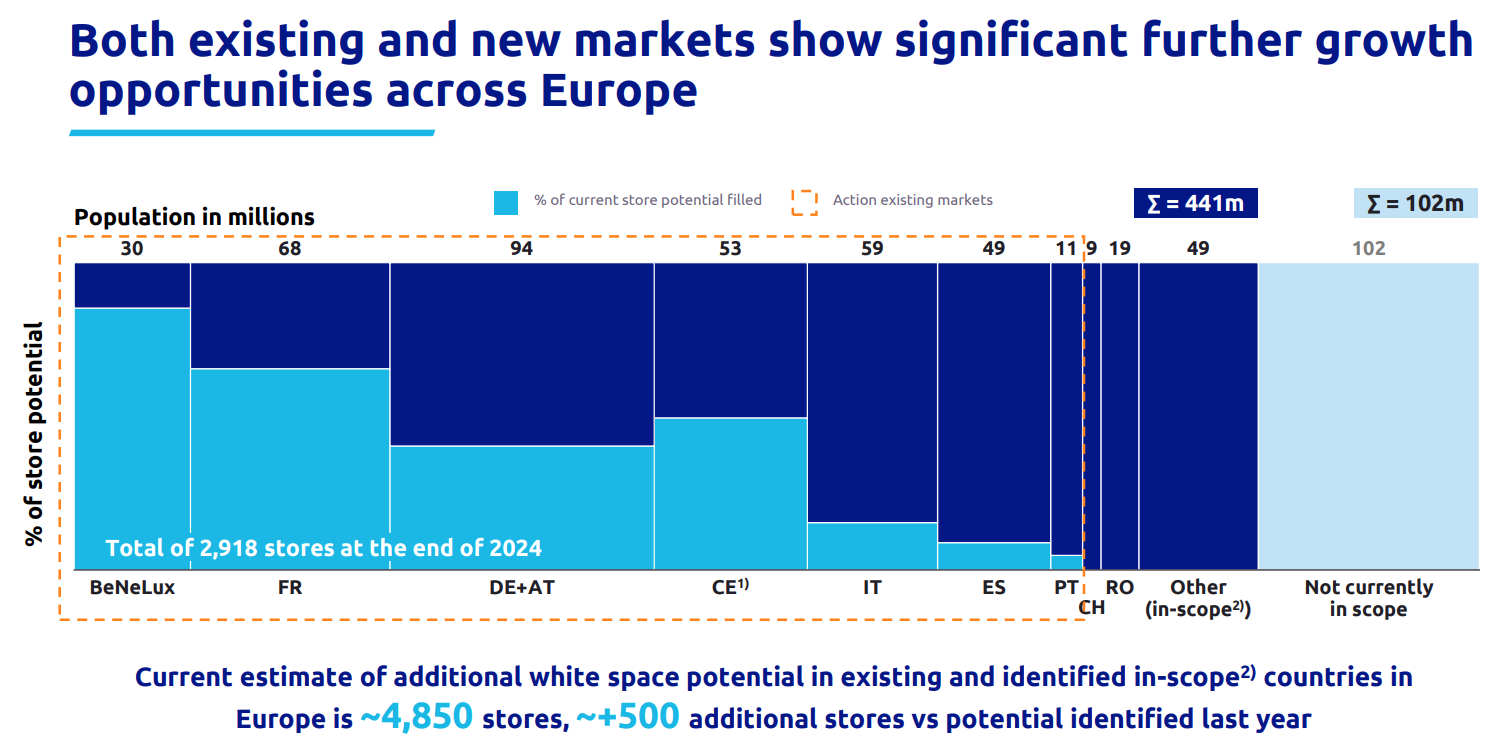
As previously established, Action's pace of new store openings has consistently accelerated year-over-year. For 2025, the company anticipates opening 370 new stores, an increase of approximately 20 stores year-over-year compared to its 2024 openings, and roughly 70 more compared to 2023 year-over-year. Should Action progressively increase its annual store openings by 20 units per year until 2029, subsequently opening approximately 450 stores annually through 2035, it is projected to fully capitalize on its current estimated white space potential by early 2036. It is crucial to note that this assessment pertains solely to the present white space potential, excluding countries not yet identified or currently outside the scope of expansion.
Based on this trajectory, I anticipate that the year-over-year growth rate in Action's store count will decelerate from 13.7% YoY in 2024 to 6.2% YoY in 2035. Concurrently, the absolute size of Action's store base is projected to expand from 2,918 at year-end 2024 to an estimated 7,668 by year-end 2035, representing a CAGR of 9.2%.
I estimate that the incremental revenue generated by this expansion will exhibit a more moderate growth profile. I forecast that revenue growth attributable to store expansion will decline from 11.4% YoY in 2024 to 4.4% YoY in 2035E (i.e., the revenue growth solely from new stores).
Combined with the previously projected LFL growth of 7.5% CAGR, this yields a total revenue growth rate that will gradually decrease from 21.7% YoY in 2024 to 11.9% YoY in 2035E.
Under these assumptions, Action's total revenue could reach an estimated €58.8 billion in 2035. This would allow the company to demonstrate the growth trends below.


9.1.3 | Profitability Analysis
In early 2024, Action communicated an expectation of achieving a 15% EBITDA margin by 2026. The company has, in fact, surpassed this target already, reporting an operational EBITDA margin of 15.1% for 2024. During CMD 2025, Action indicated a projected EBITDA margin expansion of 10-20 bps for 2025, which would result in an estimated margin of approximately 15.2%-15.3% for the year.
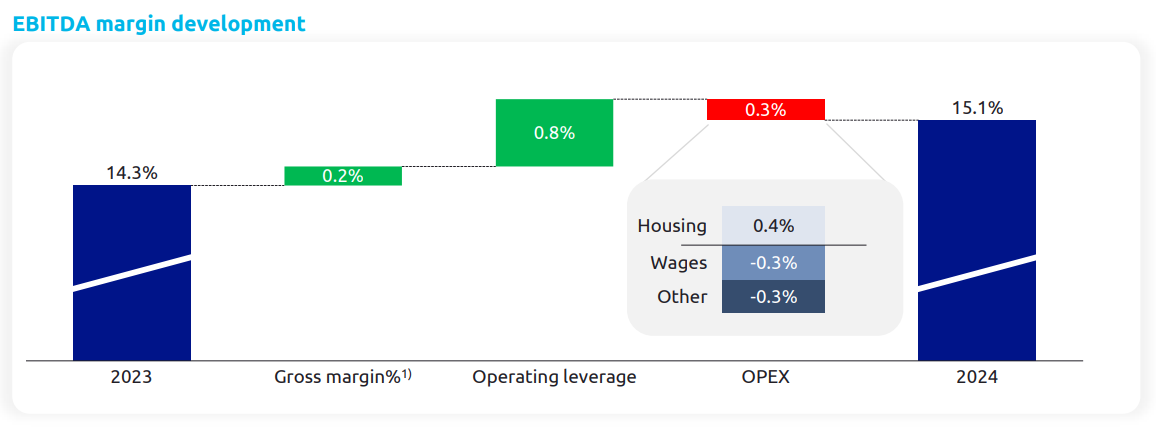
The majority of the margin improvement observed in 2024 stemmed from Action's increasing operational economies of scale. As the company expands its footprint, it is able to effectively distribute fixed costs across a larger number of stores. Furthermore, this enhanced scale provides Action with greater buying power with suppliers, a critical component of its competitive moat, alongside other previously discussed qualitative attributes.
Since 2011, Action has successfully increased its EBITDA margin by 3.1 percentage points. For my valuation analysis, I am modeling an EBITDA margin that incrementally increases by 20 bps annually from 2024 onwards, ultimately reaching approximately 17.3% by 2035.
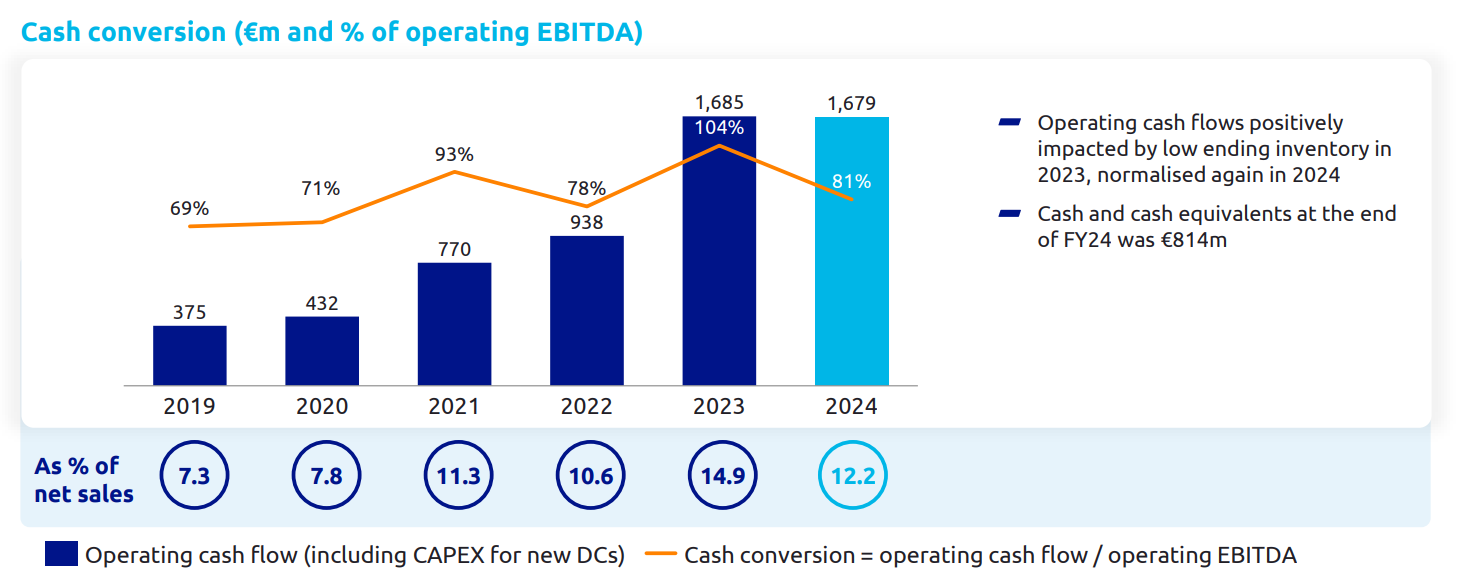
In 2024, this conversion from EBITDA to operating cash flow stood at 81%. It is important to note that the 2023 conversion rate of 104% was driven by a positive impact from lower inventory levels at year-end 2023, which subsequently normalized in 2024, resulting in a lower conversion rate in that year.
For my valuation analysis, I am employing an average conversion rate of 85% to operational free cash flow. In my view, this provides sufficient headroom to accommodate the capital requirements associated with an expansion of the company's working capital to support its expansion growth.
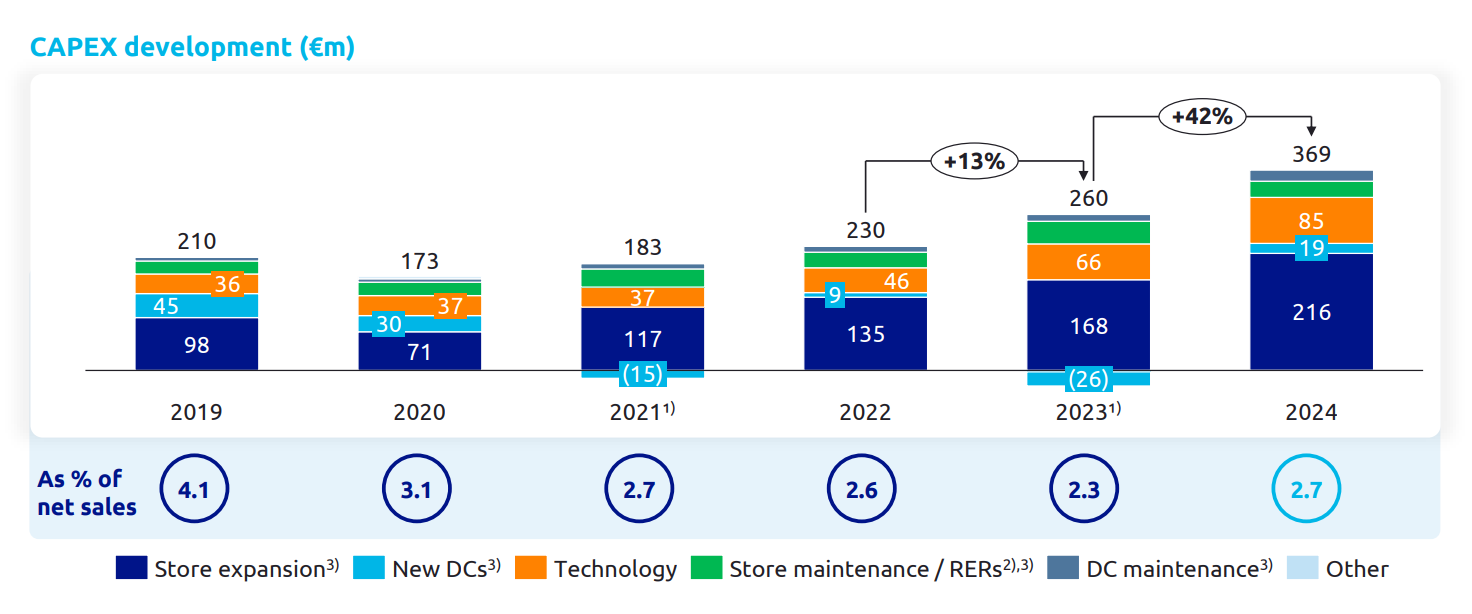
The graph above shows Action's annual CAPEX investments. Given that Action leases its retail properties and distribution centers, the company incurs virtually no initial upfront CAPEX related to real estate. Consequently, the aforementioned investments pertaining to expansion primarily consist of renovation and inventory costs.
In 2024, the average CAPEX per newly opened store was recorded at c.€614,000. For my valuation, I am projecting a progressive annual cost increase of 4% per store.
Furthermore, I have developed an estimate for Action's maintenance CAPEX across its existing store network. For this, I am utilizing Action's investment figures related to 1) store maintenance/RERs (Refurbishment, enlargement and relocation) , 2) DC (Distribution Center) maintenance, and 3) other, as detailed in the figure referenced earlier. Based on Action's average store count in 2024, this amounted to approximately €18,000 per store. I anticipate this metric will also increase by 4% annually. Similarly, I project that the company's technology CAPEX will grow by 4% per year.
With Action's increasing absolute expansion and overall scale, this translates to a 13.9% CAGR related to maintenance CAPEX. In my view, these percentages provide sufficient provision for any additional necessary investments within Action's existing network, should they be required.
When these figures are extrapolated, the resulting FCF before expansion CAPEX is projected to progressively increase from €1.5 billion in 2024 to c.€8.3 billion in 2035, representing an average CAGR of 16.5%.
9.1.4 | Multiple
In 2024, FCF before expansion CAPEX was recorded at €1,545 million, representing a substantial increase of over €1.2 billion compared to €308 million in 2019. With FCF before expansion projected to grow at a rate of 16.5% CAGR over the coming years, I believe that we can pay a fair amount for Action.
3i Group’s valuation for Action
As of March 31st, 2025, 3i Group valued its 57.9% stake in Action at £17,831 million. This valuation is derived by 3i Group using the following methodology: First, they take Action's trailing twelve-month (TTM) EBITDA run-rate, which represents the operational EBITDA adjusted for non-recurring items. For 3i Group's most recent valuation, this run-rate EBITDA stood at €2,328 million. The investment firm then applies a multiple of 18.5x to this figure, which includes a liquidity discount, resulting in an Enterprise Value (EV) for Action of €43.1 billion. To arrive at the equity value, Action's net debt position of approximately €6.3 billion is deducted, yielding an equity value of €36.8 billion. 3i Group subsequently converts this to GBP, resulting in £30.8 billion. With a 57.9% stake as of March 31st, 2025, this translates to a valuation of £17.8 billion for 3i Group's share in Action.
It is crucial to emphasize that the above valuation represents 3i Group's internal assessment of Action, and not the valuation currently reflected in 3i Group's market capitalization by investors.
Based on the projected €8.3 billion in FCF before expansion in 2035, I consider it reasonable to apply a multiple of 18.0x. Expressed as a percentage, this implies a 5.6% FCF yield on Action's implied equity value at year-end 2035, which reaches €149 billion in my model. This is a formidable figure, predicated in part on the addition of approximately 4,800 new stores. Should 3i Group maintain its 57.9% interest at that time, their stake would be valued at €86 billion, or £71.6 billion when converted using the current GBP/EUR exchange rate.
9.2 | Valuation 3i Group
As of March 31, 2025, 3i Group valued its stake in Action at £17.8 billion. All other investments within 3i Group's portfolio were estimated at £7.7 billion at that date. Collectively, these constitute 3i Group's total investment portfolio value of £25.6 billion.
Notably, while the implied valuation of Action has increased at a rate of 40.6% CAGR over the past decade, the value of 3i Group's other holdings has appreciated at a 9.0% CAGR over the same period.
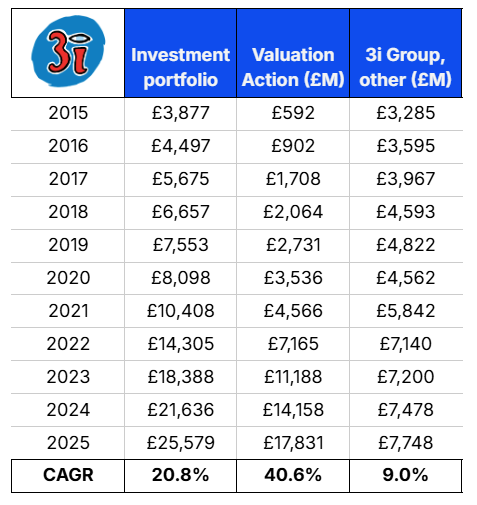
Since 2015, the total value of 3i Group's investment portfolio has grown at a 20.8% CAGR. Below is an overview of the value increase of 3i Group’s investment portfolio, including the individual value increase of Action and 3i Group’s other portfolio holdings.
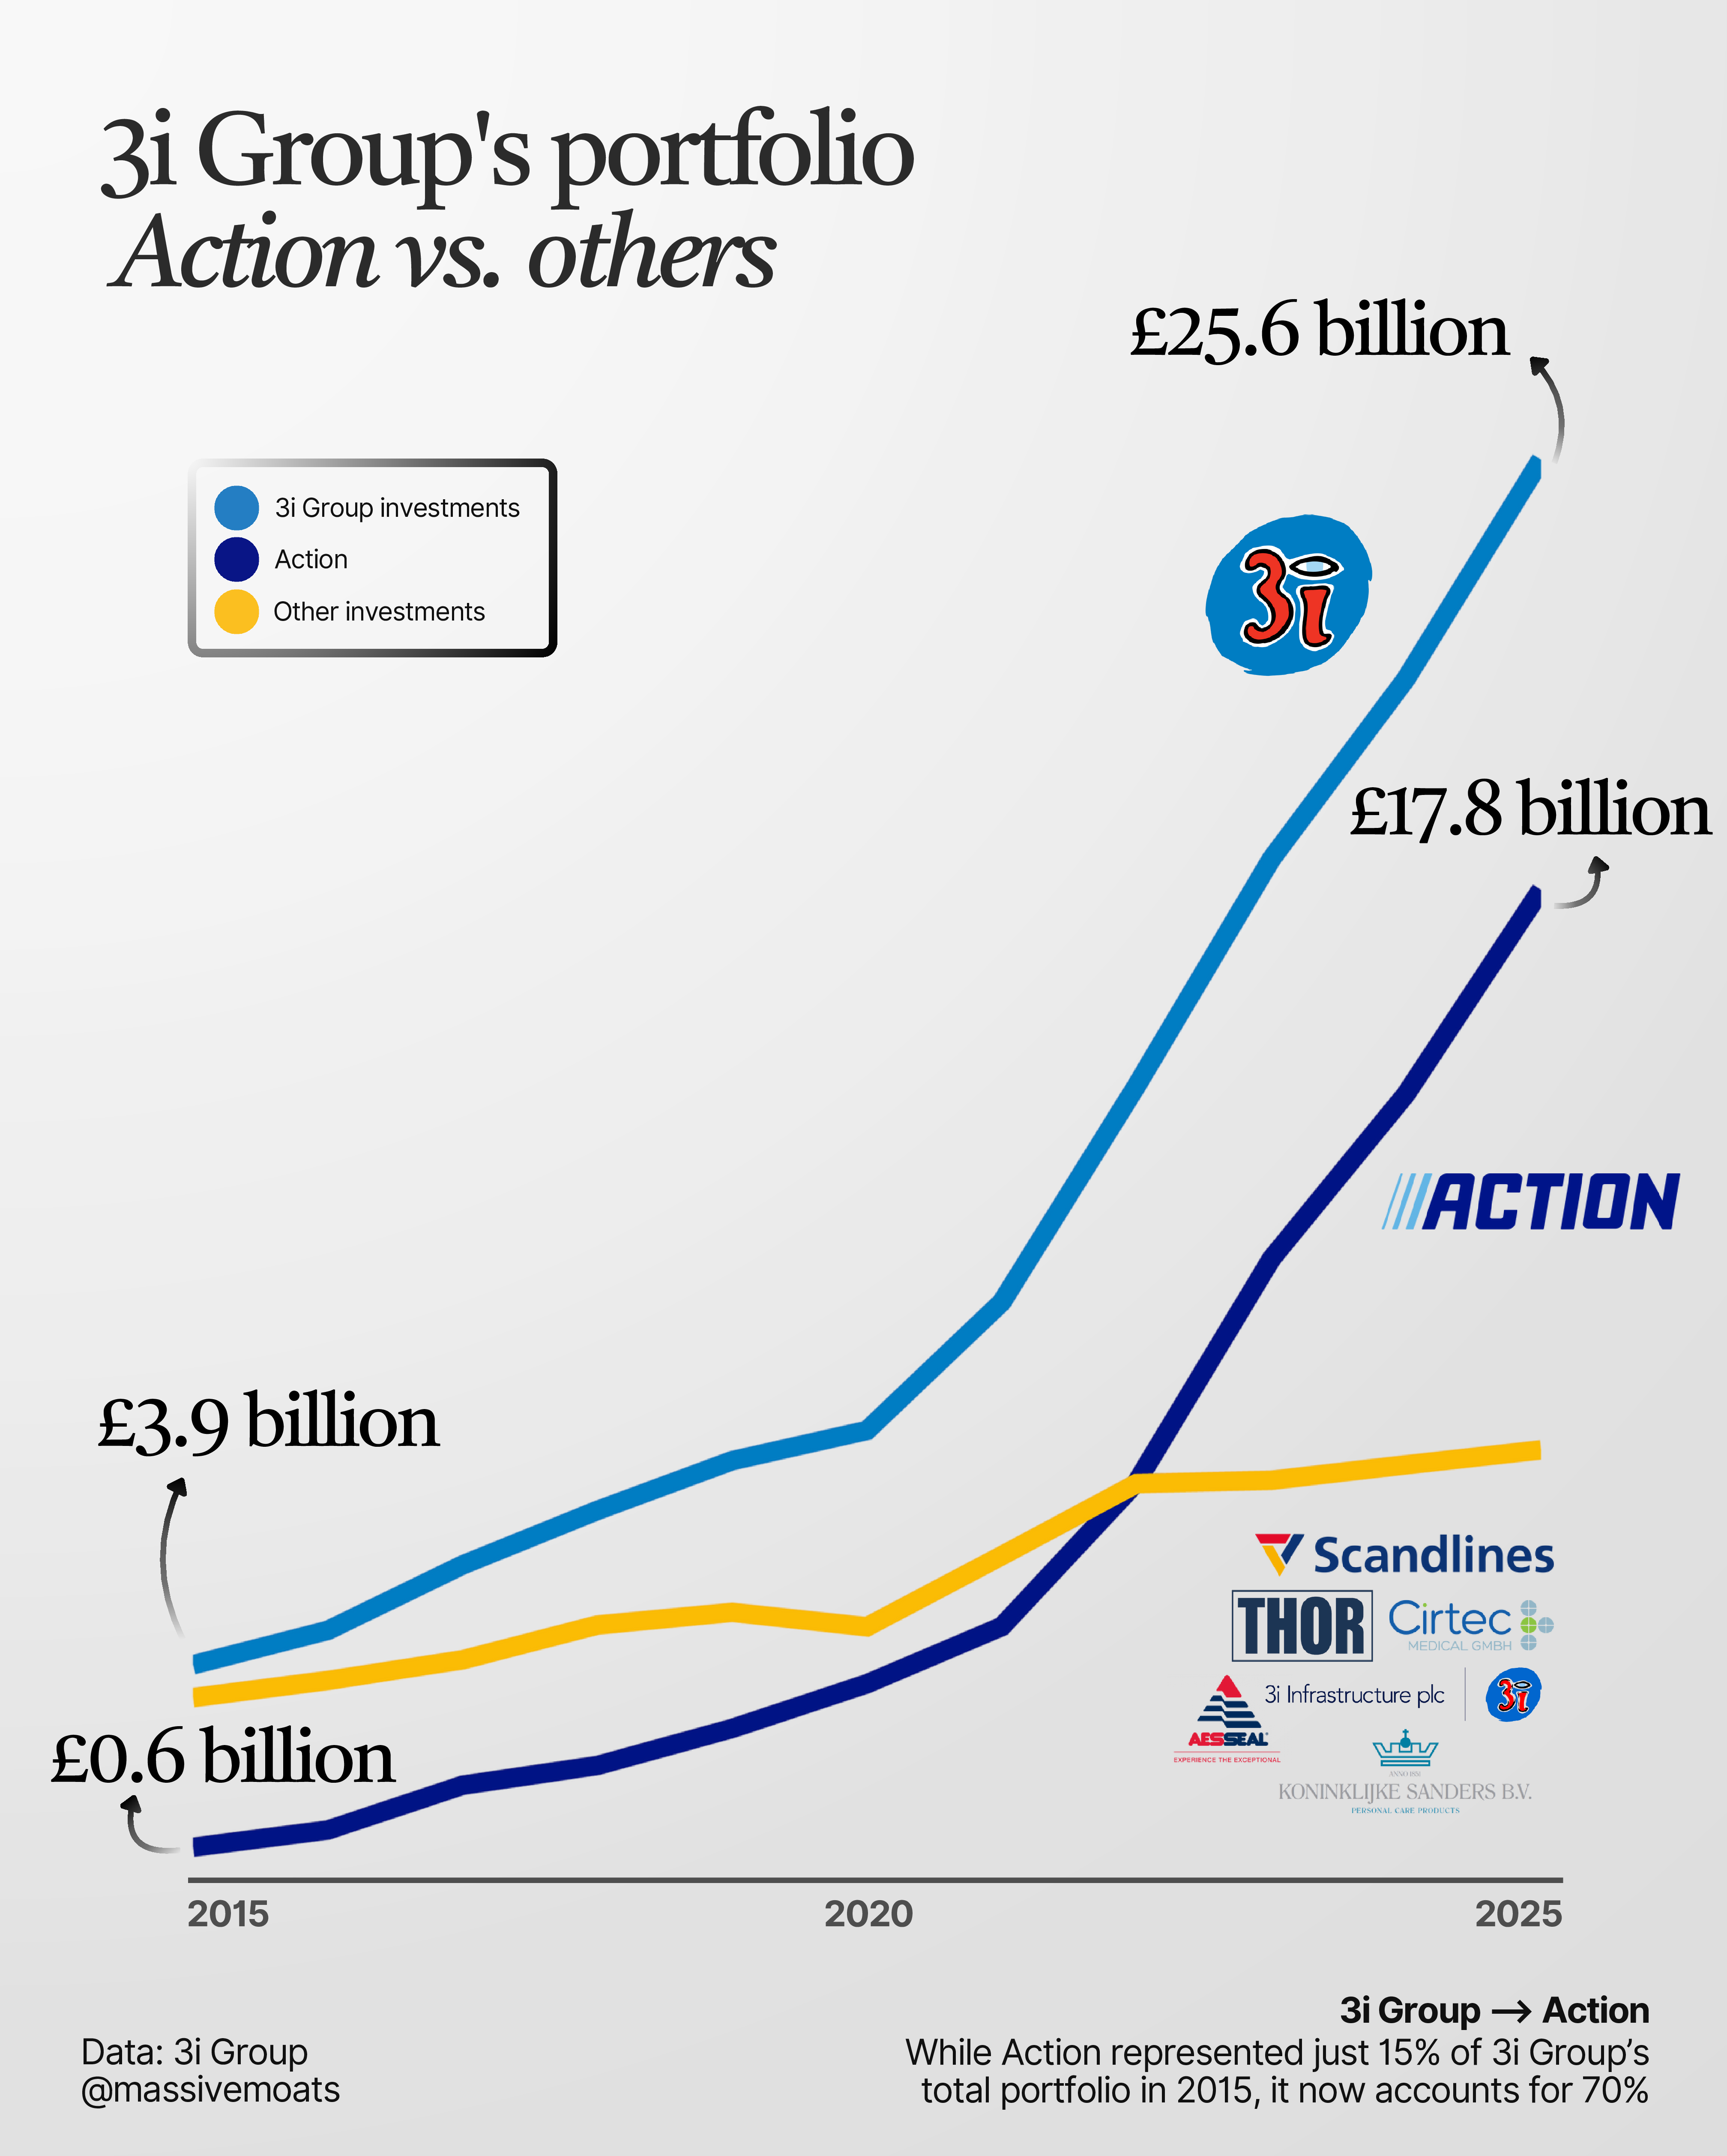
The Investment Portfolio value is not directly equivalent to 3i Group's Net Asset Value (NAV). The reconciliation between these two metrics is detailed below.
3i Group maintains a modest net debt position, which currently stands at approximately 3% of its net asset value (3i Group, 2025) (2024: 4%). This indicates that 3i Group is minimally leveraged at the holding level, a ratio commonly referred to as gearing.
This net debt position is subsequently deducted from the Investment Portfolio value. Coupled with the accounting for carried interest receivable and payable, this results in a Net Asset Value of £24.6 billion.
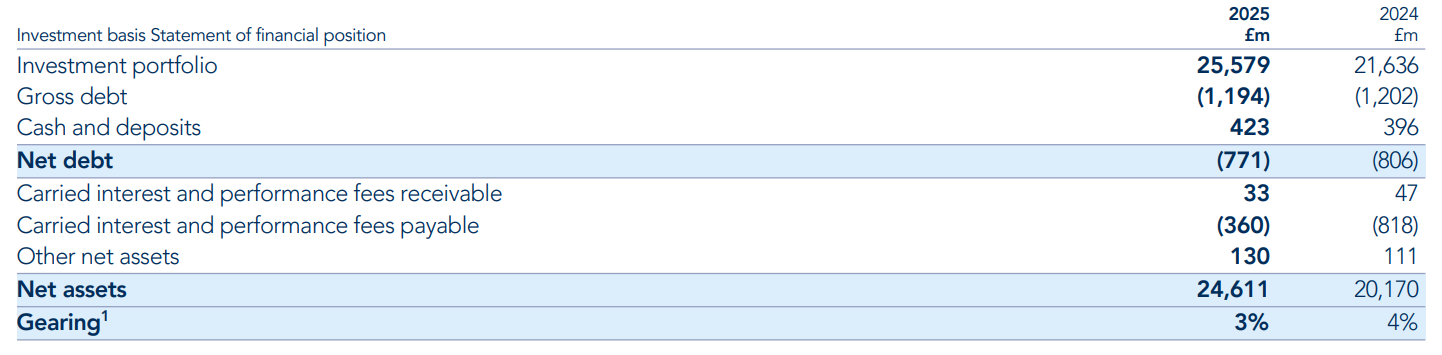
Dividing this £24.6 billion in net assets by the diluted number of shares outstanding (968,085,350 as of March 31, 2025) yields an NAV per share of 2,542 pence.
The total Net Asset Value of 3i Group as a whole has increased at a rate of 20.5% CAGR since 2015. This growth trajectory closely mirrors that of its Investment Portfolio value, which recorded a 20.8% CAGR. This marginal difference suggests that 3i Group's net debt increased slightly faster than the overall growth in its total investments.
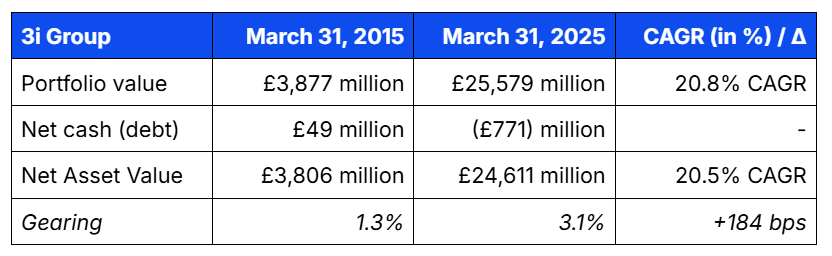
Despite an increase in 3i Group's net debt-to-equity ratio over the past decade, I assess this as well-managed, with a gearing of 3.1%. For comparative purposes, this ratio was 4.0% at the end of FY2024.
All other interests within 3i Group's portfolio have collectively grown at a 9.0% CAGR since 2015. It is important to note that this figure reflects the net effect of new investments, as well as divestments. While acquisitions reduce cash balances and increase the portfolio value of other holdings, divestments decrease the value of these holdings while enhancing the cash position. Consequently, the rate of the actual underlying value creation is likely somewhat higher than this 9% CAGR, as a portion of the value realized through divestments has also been distributed as dividends.
The "NAV -/- Action Valuation" metric, which incorporates the aforementioned cash and debt developments, has recorded a 7.8% CAGR from March 2015 through March 2025. This rate is 120 basis points lower than the growth in 3i Group's other interests. This discrepancy is primarily attributable to the increase in Action's net debt; when isolating this effect, the CAGR for 3i Group's other holdings rises to 9.1%.
Disregarding the evolution of 3i Group's net debt—as I anticipate a growing stream of cash inflows to the holding company over the next decade from Action's increasing capital generation and dividend distributions—a CAGR of 8% for 3i Group's other interests represents a realistic expectation in my view. In my valuation model, this translates to a value of £17.4 billion by year-end 2035. Together with Action, this results in an estimated figure of £89 billion for 3i Group in 2035.
Below is an overview of the above assumptions.
9.3 | Valuation Overview
A summation of the foregoing projections:
A valuation of £149 billion for Action by year-end 2035. This implies a value of £71,602 million for 3i Group’s 57.9% stake, assuming 3i Group maintains its current ownership interest.
A valuation for 3i Group's other investments of £17,422 million by year-end 2035.
Cumulatively, this yields a total implied value for 3i Group of £89 billion by 2035, year-end. Against the current market capitalization of c.£39 billion, this translates to an implied IRR of 8.1% CAGR, which excludes any dividend distributions.
This calculation also excludes future changes in 3i Group's outstanding shares. A chart illustrating the past development of its diluted outstanding shares is included below.

The number of ordinary shares has remained largely constant since 2011 (970.5 million vs. 968.1 million in FY2025). Conversely, 3i Group's treasury shares have significantly decreased, from 19.7 million as of March 31, 2011, to 8 million as of March 31, 2025. Additionally, the number of share awards, which lead to dilution, currently stands at 2.7 million (compared to 3.5 million in 2011).
Capital Allocation
To date, 3i Group has predominantly reinvested the capital generated from its portfolio companies (dividends and disposals) back into its investment portfolio. In addition, 3i Group distributes dividends.
The dividend payments since 2011 are presented in the chart below. For FY2025, 3i Group is paying a dividend of 73 pence per share, representing a 20% year-over-year increase compared to FY2024.

At the current share price of 4,000 pence, this equates to a dividend yield of 1.8%.The return in the form of dividends, and any potential future increases in these dividends, would be in addition to the implied 8.1% CAGR IRR calculated above.
Future capital allocation concerning increased stakes in Action has not been factored into the aforementioned projections. Assuming our forecast aligns with actual performance, 3i Group could maximize returns by utilizing capital distributions received from Action in the coming years to incrementally increase its ownership, provided existing shareholders are amenable to divesting their positions.
To illustrate, in March 2019, 3i Group held a 44.3% stake in Action (Eurofund V held 33.2% at that time). Over the past six years, 3i Group has expanded its ownership from 44.3% to 57.9% as of March 2025. Should 3i Group be able to further increase its stake to, for example, 65% over the next decade, the RR as outlined above would register at 9.1%. If 3i Group successfully expands its interest to 72.5%, the IRR would then reach 10.0%.
This explicitly does not constitute financial advice.
Chapter 10 | Conclusion
I assess 3i Group as a high-quality enterprise. Under the leadership of Simon Borrows, the investment firm has undergone a remarkable reinvention in the aftermath of the credit crisis, a period during which it faced existential challenges. It was through the confidence of its existing shareholders in 2009, amidst peak market turmoil, that 3i Group was able to rise from the ashes.
The results of this reinvention have been profound. Shareholders who maintained their positions have realized a significant return on their granted trust, primarily driven by a single investment made in the summer of 2011: Action.
Currently accounting for 70% of 3i Group's investment portfolio, Action itself is propelled by a robust management team, including members from 3i Group, who are jointly committed to building the future of this Dutch company. With a European footprint now spanning 14 countries, this well-oiled machine continues to execute its expansion strategy effectively: 267 new stores in 2021, 280 in 2022, 303 in 2023, 352 in 2024, and an estimated 370 for 2025. With an estimated white-space potential of 4,850 new stores, the company's growth trajectory remains substantial.
On May 15th, I established a c.10% position in 3i Group. Despite the current premium to its NAV at which the company trades, I consider an investment in 3i Group to be a valuable addition to my portfolio. With an 8.1% IRR, excluding dividends, SBB and potential increases of its Action stake, I am positioning for the future value creation anticipated from both Action and 3i Group.
Eelze Pieters
Juni 2025
Transaction Notice
On May 15, 2025, subsequent to the completion of Version 1.0 of this deep dive in November 2024, I initiated an initial position in $III.L.
Colophon
Published by
Massive Moats
Author
Eelze Pieters
Social Media
@massivemoats
Contact
T +31 (0)620278347
info@massivemoats.com
https://massivemoats.com
June 2025
© 2025 Massive Moats
Disclaimer: NFA / E&OE. The information above is provided for general informational purposes only and should not be construed as investment, accounting and/or financial advice. You should consult directly with a professional if financial, accounting, tax or other expertise is required.
Excellent write up!
What a deep dive into 3i, congrats!
I wrote a shorter version than yours back in April, and I can only agree with your overall view on the stock.
https://nathansresearch.substack.com/p/action-a-3i-group-success-story
A few questions and thoughts:
- What’s your view on a potential U.S. expansion for Action, possibly filling the gap between dollar stores and retailers like Walmart?
- I find the assumption of stable ownership in Action at c.57.9% a bit conservative. In fact, 3i’s consistent increase in its stake over the past years seems like an additional structural advantage.
- I'm personally a bit more conservative on the pace of store openings in Europe. I see a potential ceiling at around 400 new stores per year, followed by a gradual decline in growth.
Happy to discuss that further.