
Amazon Q1 2026 Analysis
An analysis of the progress and future potential of Amazon

Table of Contents
1. Introduction
2. Key Figures
3. Top-Line Developments
4. Amazon Web Services (AWS)
5. Online Stores
6. Physical Stores
7. Third-party Seller Services
8. Subscription services
9. Advertising services
10. Profitability
11. Balance Sheet, Capital Generation & Allocation
13. Valuation
14. Conclusion
1. Introduction
On April 29, 2026, Amazon published its Q1 2026 results. In this article, I will share my analysis of these figures and Amazon’s future potential.
This article focuses on the most recent developments within Amazon. Analyses of previous quarters can be read via the links below:
Amazon Q4 2025 Analysis (February 19, 2026)
Amazon Q3 2025 Analysis (October 31, 2025)
This article does not constitute investment advice. At the time of writing, June 16, 2026, I held a long position in Amazon ($AMZN). For readability, the numbers in this article are sometimes rounded, for instance, to the nearest billion.
2. Key Figures
Revenue (+14.2% Y/Y): Over the past four quarters, Amazon’s revenue increased by 14.2% Y/Y to $743 billion TTM. This indicates an acceleration in growth compared to previous quarters (Q4 2025: +12.4% Y/Y | Q3 2025: +11.5% Y/Y | Q2 2025: +10.9% Y/Y | Q1 2025: +10.1% Y/Y, all TTM).
Operating Income (+19.2% Y/Y): Over the past four quarters, Amazon’s operating income rose by 19.2% Y/Y to $85 billion, resulting in an operating margin that expanded by 48 bps Y/Y to 11.5% TTM. In Q1 2026, Amazon achieved its highest quarterly operating margin ever at 13.1%.
Net Income (+37.7% Y/Y): Amazon’s net income surged by 37.7% Y/Y to $91 billion TTM, partly driven by accounting gains on its investments in private companies (e.g., Anthropic).
EPS (+36.2% Y/Y): Amazon’s earnings per share (EPS, diluted) increased by 36.2% Y/Y to $8.36 per share TTM.
OCF -/- SBC (+38.2% Y/Y): Amazon’s operating cash flow (adjusted for stock-based compensation, SBC) grew by 38.2% Y/Y to a record $129 billion TTM.
CapEx (+62.2% Y/Y): The level of Amazon’s annual capital expenditures also climbed to a record high of $151 billion TTM (+62.2% Y/Y).
FCF -/- SBC: These massive investments are causing the company’s free cash flow (adjusted for SBC) to become increasingly negative, coming in at -$22 billion TTM (Q1 2025 TTM: +$0 billion).
3. Top-Line Developments
In Q1 2026, Amazon reported a revenue of $182 billion. This represents a 16.6% year-over-year (Y/Y) increase in absolute dollars compared to Q1 2025, when the company generated $156 billion in sales. Excluding a 180-basis-point (bps) tailwind from foreign exchange fluctuations, revenue growth at constant currency stood at approximately 15% Y/Y, according to Amazon.
Over the trailing twelve months (TTM), Amazon’s revenue reached $743 billion. This marks a 14.2% Y/Y increase compared to the Q1 2025 TTM figure, which stood at $650 billion. These figures demonstrate a clear acceleration in Amazon’s growth.
The chart below illustrates the trajectory of Amazon’s TTM revenue growth over recent years per quarter.

Amazon’s growth acceleration is primarily driven by the strong performance of Amazon Web Services (AWS). This division saw its revenue increase by 28% Y/Y at constant currency (cFX) to $38 billion in Q1 2026 (Q1 2025: $29 billion). The Advertising Services segment also performed strongly, generating $17 billion in revenue, which represents a 22% Y/Y cFX increase (Q1 2025: $14 billion).
Alongside AWS, Amazon’s other core segments are also experiencing an acceleration in growth:
Online stores, which still accounts for 37% of total revenue, posted a 9% Y/Y cFX revenue growth in Q1 2026, bringing its revenue to $64 billion.
Third-party seller services, accounting for 24% of the total, showed a 12% Y/Y cFX revenue growth, also marking an acceleration.
Subscription services (7% of the total) recorded a 12% Y/Y cFX revenue growth, coming in slightly above its annual average.
Physical stores (3% of the total) was the only segment to see a deceleration in revenue growth, slowing to 4% Y/Y cFX in Q1 2026.
It is impressive to see that 97% of Amazon’s segments (expressed in absolute revenue) demonstrated either sustained or accelerated revenue growth in Q1 2026. This occurred during a quarter marked by numerous global developments that, realistically, could just as easily have triggered a growth slowdown across multiple segments. For a company already generating over $700 billion in annual revenue, these growth accelerations are perhaps even more remarkable. All in all, these are positive developments to witness in Amazon’s top line.
The table below outlines the financial performances of Amazon’s segments over recent quarters.
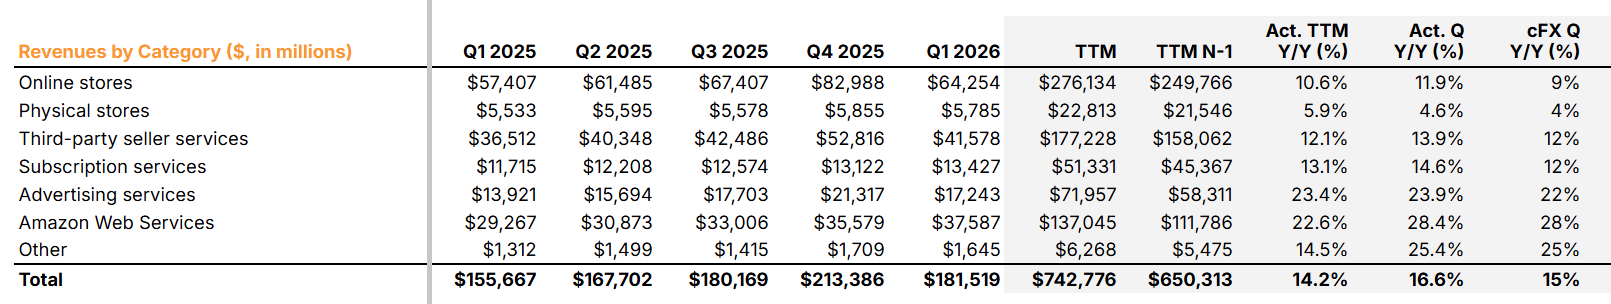
In Q1 2026, AWS and Advertising Services experienced growth that outpaced the company-wide growth rate of 16.6% Y/Y including F/X (15% Y/Y cFX). Driven by a 28.4% Y/Y growth in Q1 2026 (up from 23.6% Y/Y in Q4 2025), AWS’s share of Amazon’s total revenue increased to 18.5% on a TTM basis. Similarly, Advertising Services expanded its footprint, reaching 9.7% of total revenue (also on a TTM basis).
The table below displays the revenue per segment expressed as a percentage of Amazon’s total revenue.
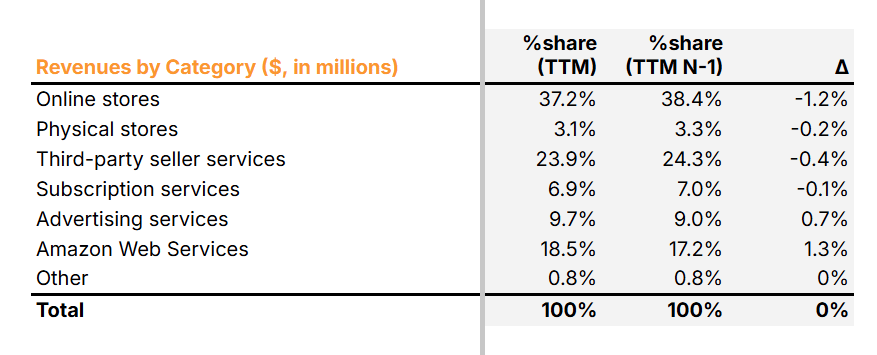
Consequently, Amazon has further shifted its overall revenue mix toward the high-margin revenue disproportionately generated by the AWS and Advertising Services segments. This shift has resulted in a steadily expanding operating profit margin, which hit a new record of 13.1% of Amazon’s total sales in Q1 2026. As a shareholder, I find this to be a highly encouraging development to witness.
The following chapters will provide a more detailed analysis of each individual business segment of Amazon.

This article continues below for paid members of Massive Moats Pro. To continue reading, consider becoming a paid member. (Avoid a 30% surcharge from Apple or Google Play Store by subscribing via a web browser instead of via the Substack application on your smartphone.)